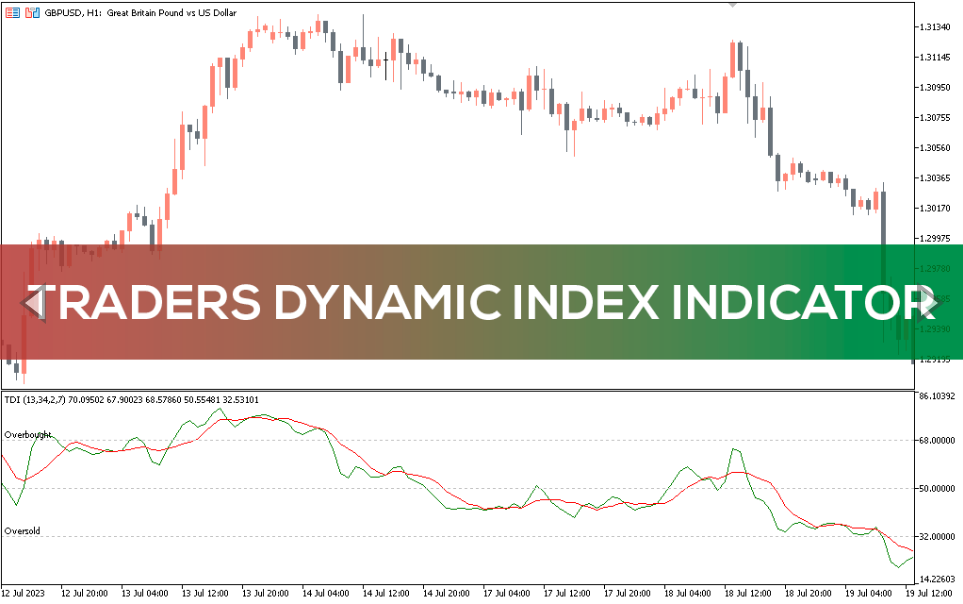
Best Traders Dynamic Index Indicator
The Traders Dynamic Index is a momentum and trend following indicator that measures market volatility, trend direction and trend reversal zones.
Traders Dynamic Index (TDI) is a popular MetaTrader 5 (MT5) developed by combining momentum and trend following indicators.
Thus, it is a momentum and trend following indicator that shows the current market volatility and trend strength.
The indicator is one of the most versatile trend analysis tools used in the financial industry to determine market dynamics, determine trend direction and identify potential reversal zones.
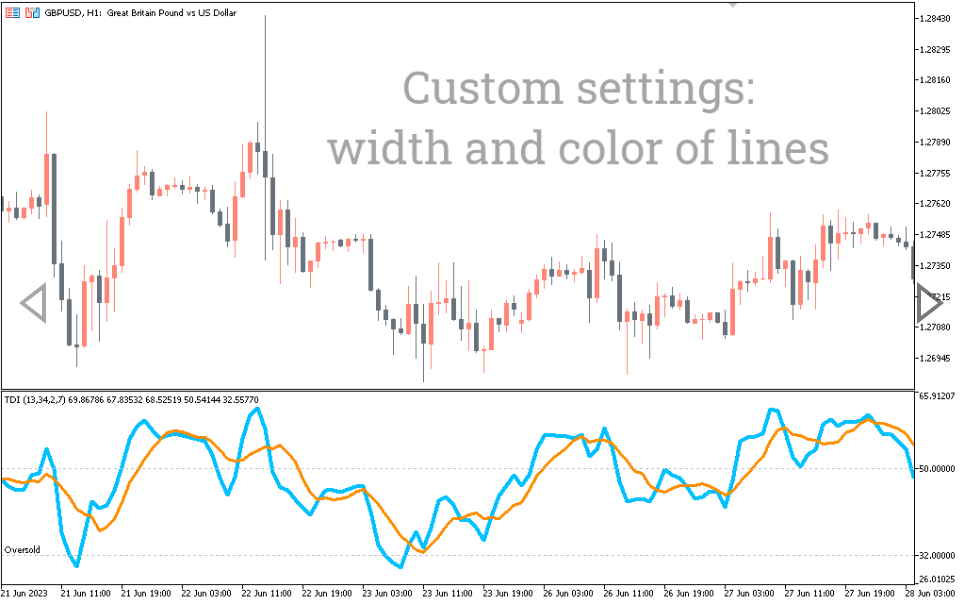
Elements of the Traders Dynamic Index Indicator
TDI includes moving average, Bollinger bands and relative strength index (RSI) indicators. Each of the indicators performs a separate task when analyzing the market.
The moving average, also known as the market’s baseline, determines the direction of the trend, while the RSI tracks the speed and rate of change in the prices of any asset of interest. Finally, Bollinger Bands measure market volatility and identify overbought/oversold price zones.
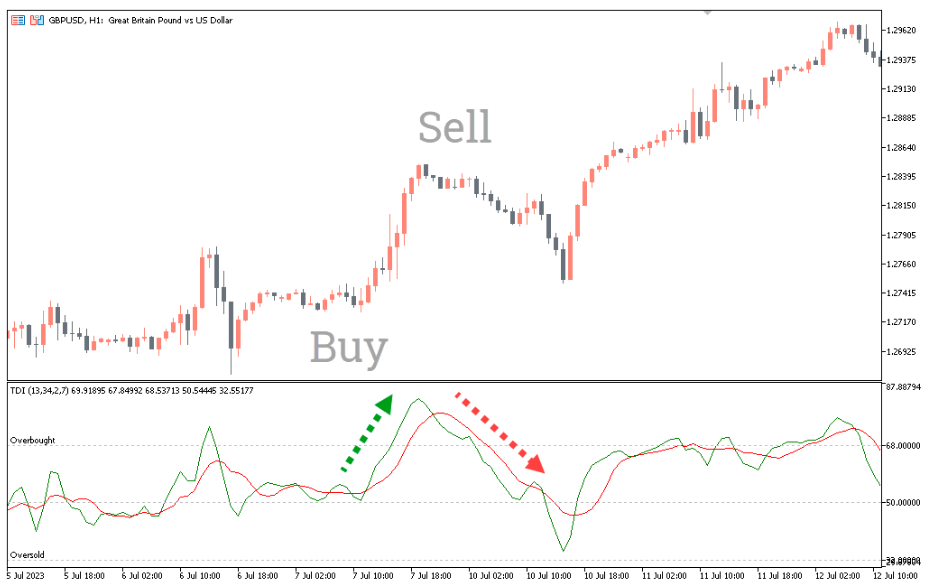
How to trade with the Traders Dynamic Index (TDI) indicator?
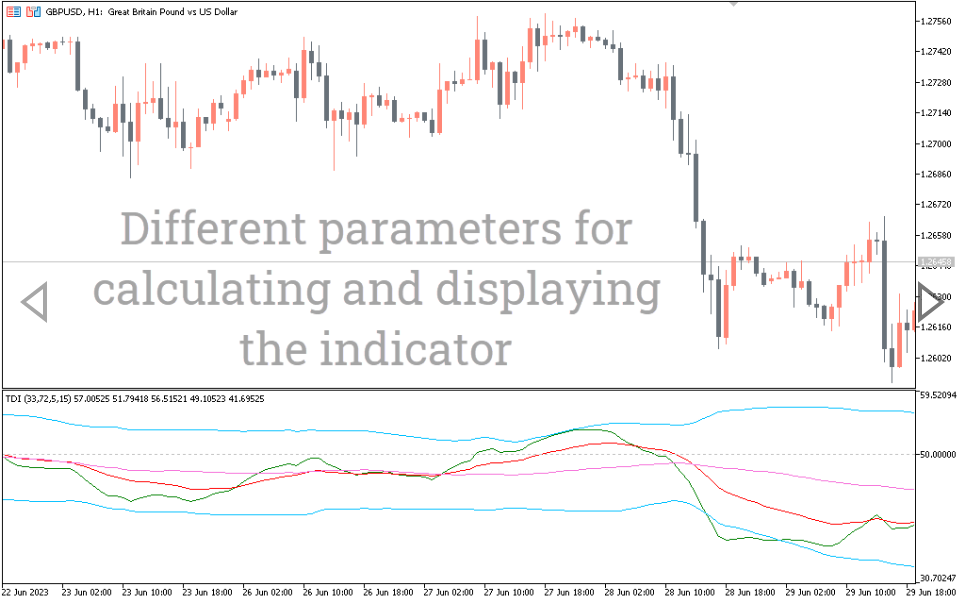
The image above shows the market analysis of the Traders Dynamic Index for the EUR/USD currency pair.
The green line represents the RSI, the red line represents the trade signal, and the blue line represents the volume Bollinger Bands. Buy and sell signals are generated when the lines cross up/down.
Thus, a buy signal is when the red and green lines cross the yellow line upward. Conversely, a sell signal is when the green and red lines cross the yellow line downwards.
Conclusion
The Traders Dynamic Index indicator is an incredible Forex trading tool that can be used with other technical indicators or as a standalone indicator. It is also a dynamic indicator optimized to identify scalping, day/intraday and swing trading opportunities in the financial market.

Reviews
There are no reviews yet.