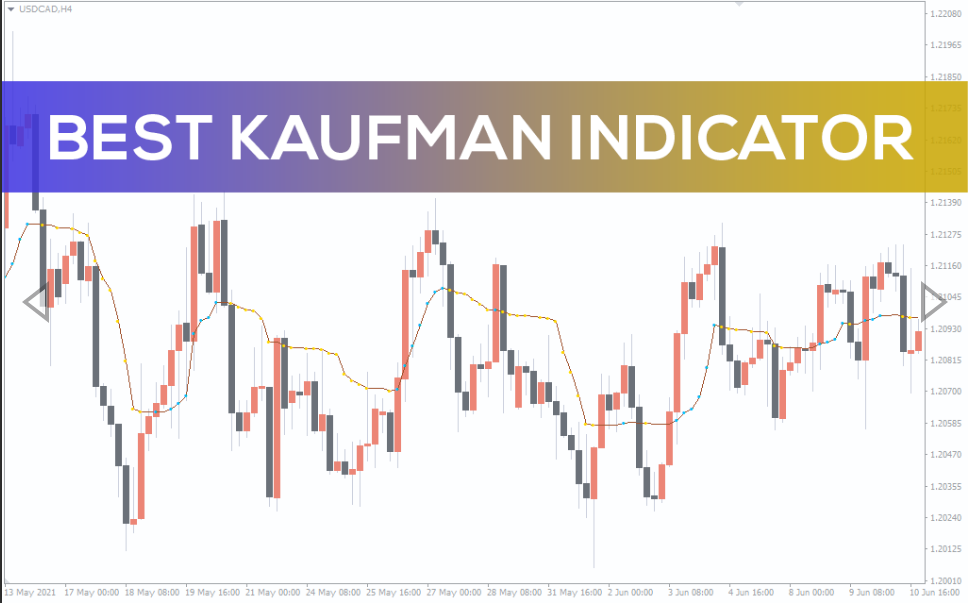
Best Kaufman Indicator
Learn to trade forex & stocks using the best trend-following MT4 indicator. It determines current trends, trend reversals, and dynamic support-resistance zones.
The Best Kaufman represents a unique MT4 indicator used for trend-following trading purposes in forex and stock markets. It applies a 9-day Adaptive Moving Average (AMA) that smooths choppy price movements, eliminates market noise, and accurately recognizes current trend conditions. AMA can adjust its sensitivity to price changes based on the calculated volatility. It becomes more sensitive when the price moves smoothly in one direction and less sensitive during volatile markets.
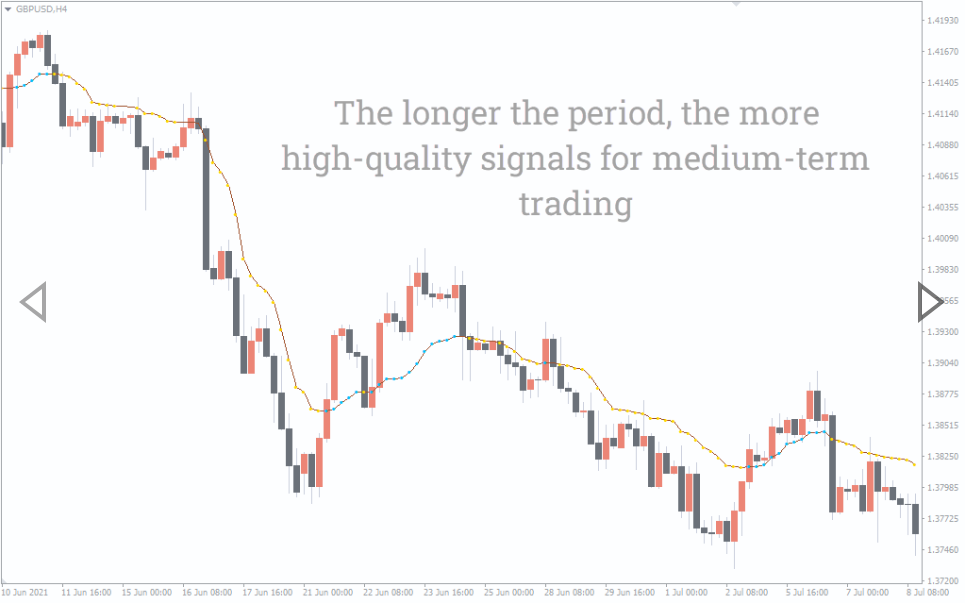
Technically, the Best Kaufman may delay in confirming a trend since it waits for a significant change in price actions. As a result, it may generate fewer signals compared to standard moving averages even though you apply it in lower timeframes. This guide will explain how to identify highly probable trading opportunities using the Best Kaufman MT4 indicator.
How to Apply the Best Kaufman Indicator for Determining Buy-Sell Signals in MT4
The Best Kaufman perfectly adapts to the current market volatility and automatically determines the indicator’s sensitivity to price-action changes. This feature enables the moving average to generate fewer indications in sluggish markets rather than producing frequent weak signals.
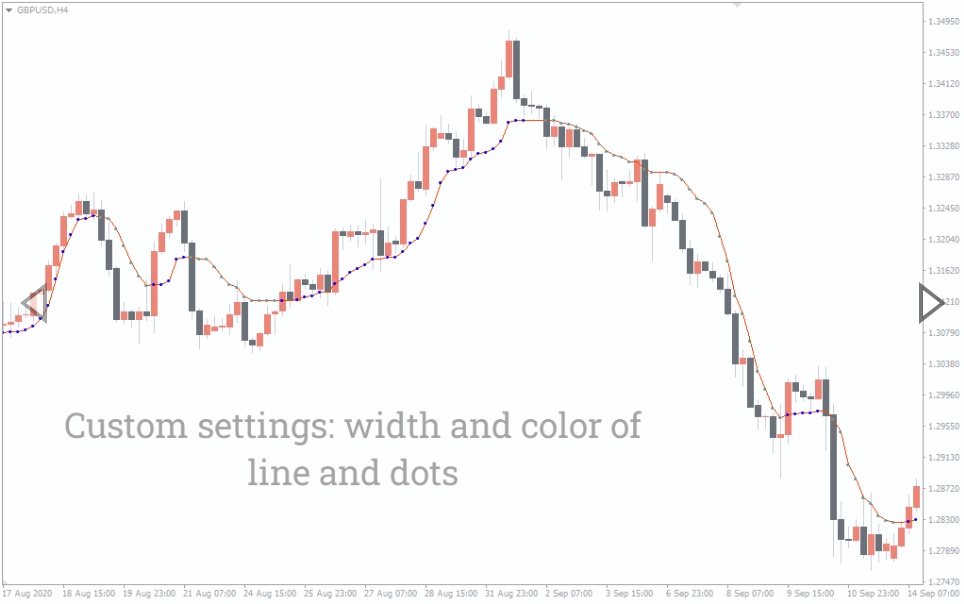
While anticipating buy-sell opportunities, use the Best Kaufman trend signal with price-action strategies for better results. For instance, a solid bearish candlestick pattern formed below the moving average line while the indicator signals a downtrend can be an ideal option to go short. The Best Kaufman plots blue dots to signal a bullish trend. Conversely, the green dots indicate the market is trending bearish.
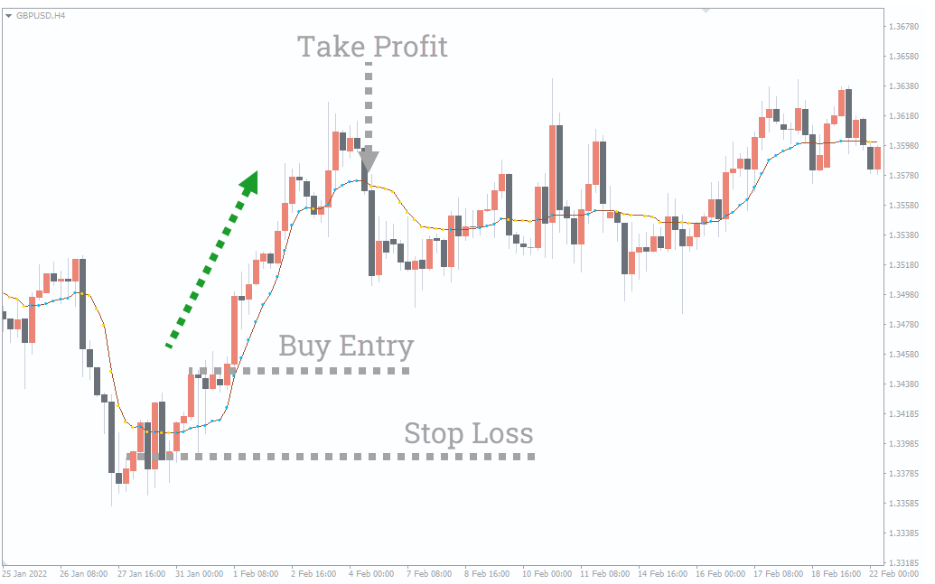
In the above GBP/USD H4 chart, the British Pound was initially trending bearish against the US Dollar. At a point, the price rebounded for a bullish move and broke above the MA level. While the price was exceeding the dynamic resistance, the Best Kaufman plotted blue dots indicating a bullish trend reversal. Meantime, the chart printed several bullish hammers rejecting the adaptive moving average support and confirming a buy signal.
In the above example, we considered Best Kaufman’s AMA as dynamic support and placed a stop-loss limit around 15 to 20 pips below the indicator level. Also, we decided on a buy-exit once the price dropped below the AMA line. For short entries, try placing the stop loss limit above the current AMA. After you trigger a sell order, wait for a bullish breakout at the Best Kaufman indicator level to decide on profit-taking. Consider a breakout as valid only when a price candle successfully closes above or below the AMA.
Conclusion
The Best Kaufman indicator helps MT4 users trade within the correct market trend. However, a trend confirmation cannot be simply taken as a straightforward trade signal. You need to analyze the price levels and wait for the perfect price action signal before entering a buy or sell. The Best Kaufman can help you make trading decisions with price-level and candlestick pattern-based trend-following strategies.
You must be logged in to post a review.

Copyright 2025

Reviews
There are no reviews yet.