BB OSMA Indicator spots potential price breakout & trend reversals in MT4. Suits any trend-following trading strategy
The BB OSMA Indicator is an MT4 technical analysis tool widely used by traders to identify market trends and potential buy/sell signals. This indicator is mostly admired by day and intraday traders because it weighs more on recent changes in price action and delivers real-time trend signals.
In this article, we’ll take a closer look at the BB OSMA, how it works, and how you can use it to improve your trading strategy.
How to Spot Buy-Sell Signals Using the BB OSMA Indicator in MT4
The BB OSMA Indicator is a derivative of the Moving Average Convergence Divergence (MACD) indicator. It is designed to track momentum in the market and identify potential trend changes.
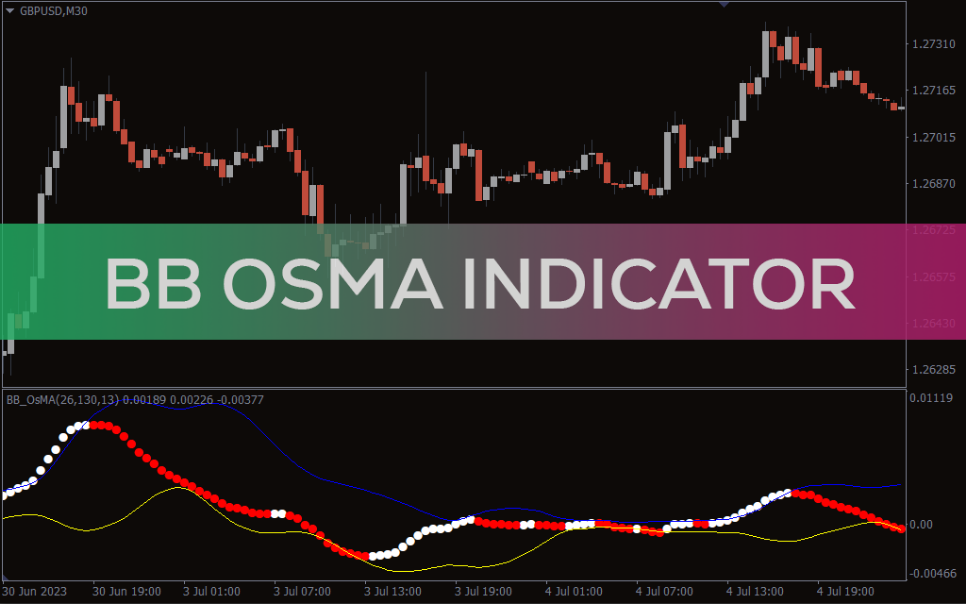
The indicator value is calculated by subtracting the 26-EMA from the 12-EMA. The result is then plotted as a histogram, with positive values indicating bullish momentum and negative values indicating bearish momentum.
In the above example, GBP/USD plotted a bearish breakout of the triangle pattern. Meanwhile, the BB OSMA level turned red and dropped from the upper band to confirm a sell entry. Conversely, enter buy when the dotted line is white and rebounds from the lower band while the price plots a bullish breakout.
Conclusion
The Indicator is simply the best tool to identify market trends and potential buy/sell signals in all trading sessions. Traders can use it in MetaTrader in a variety of ways, including trend identification, divergence analysis, and buy/sell signals. Also, it smoothly adjusts to any trading strategy and works as a trade signal filter. If you’re looking to improve your overall trading accuracy, consider adding the BB OSMA Indicator to your MT4 toolbox.
Reviews
There are no reviews yet.
Be the first to review “BB OSMA Indicator” Cancel reply
We use cookies to ensure that we give you the best experience on our website. If you continue to use this site we will assume that you are happy with it.Accept


Reviews
There are no reviews yet.