Average Daily Range (ADR) Indicator
The Average Daily Range (ADR) Indicator shows the average range of a currency pair in pips over 14 periods of days
The volatility of the forex market can provide valuable information on the activity of the day. Traders do enter trades when the volatility is high. Thus, low volatility is an indication that the market is quiet and choppy.
Forex traders use the Average Daily Range (ADR) to calculate the trading range for the day. However, calculating this might be time-consuming as quick decisions are needed to be taken. The Average Daily Range Indicator helps traders calculate the daily range of the day, thus, saving time.
The Foundation
The Average Daily Range (ADR) Indicator shows the average range of a currency pair in pips over 14 periods of days. By showing the trading range of the day, forex traders will know the volatility condition of the market.
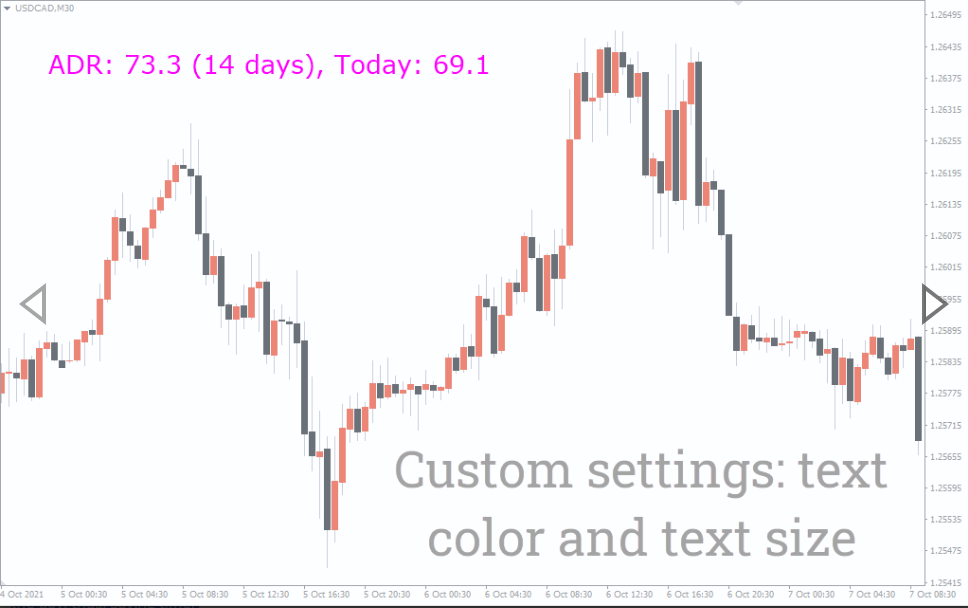
The average range of the day is displayed by this indicator on the left top corner of the chart as seen in the diagram below.
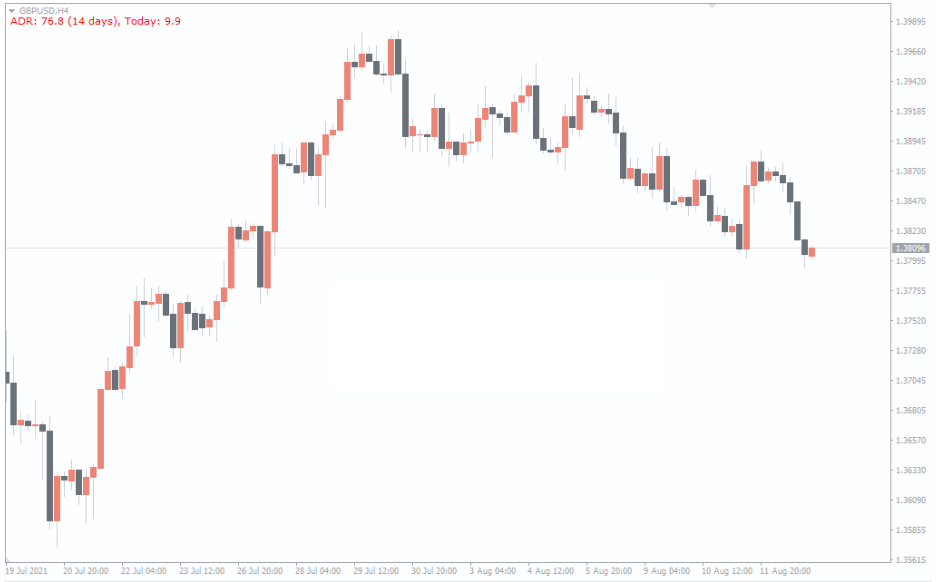
From the GBP/USD H4 chart above, the indicator displayed both the ADR values of the past 14 days as well as today’s ADR value. The GBP/USD ADR value for the past 14 days is 76.8 pips. Consequently, the ADR value for today is 9.9 pips. This is an indication that the NZD/USD volatility for today is quite low.
When the ADR value is above the average range, it shows that the volatility of the day is higher. Thus, there’s a spike in movement of the currency pair when today’s ADR value is higher than the past 14-day value.
This indicator can be used to find the daily support and resistance zones. Furthermore, this indicator can be used to generate signals for short-term traders. In addition, traders can use the ADR pips value for their take-profit level.
This indicator is also useful for intraday traders. These traders look for breakout and reversal opportunities when the price reaches the peak of the daily range.
How to calculate the Average Daily Range value
This indicator calculates the ADR value by taking the distance between the high and the low of the past 14-day period, summing them together, and finally dividing the result by 14.
For example, if the daily range of a currency pair for the past 14-day period are 55,76,34,42,66,89,65,45,22,101,78,33,67, and 90, The ADR value will be (55+76+34+42+66+89+65+45+22+101+78+33+67+90)/14 =61.6 pips
The ADR value is thus approximately 62 pips.
How to trade using the Daily Average Range Indicator
This indicator can be used to trade the range and the break. A breakout trade can be placed when the ADR current value is higher than the past 14-day value, and the high or low candle of the day is broken. Traders should place a buy or sell trade in the direction of the breakout.
Moreover, a reversal trade can be placed when the price reaches the high or low of the day and bounces back. Take-profit and stop-loss should be placed according to price action analysis.
Conclusion
The Average Daily Range Indicator for MT4 is a valuable tool used to know the market condition. This indicator displays the 14-day daily range and the current ADR value.
When the current ADR value is higher than the past 14-day value, the market volatility is high. However, when the current ADR value is lower than the previous 14-day value, the market volatility is low.
This indicator can be used to know when to enter trade as well as exit the market.
You must be logged in to post a review.

Copyright 2025


Reviews
There are no reviews yet.