Forex market trends from the best Auto Trendlines Indicator for MT5. Draw automatic trend lines.
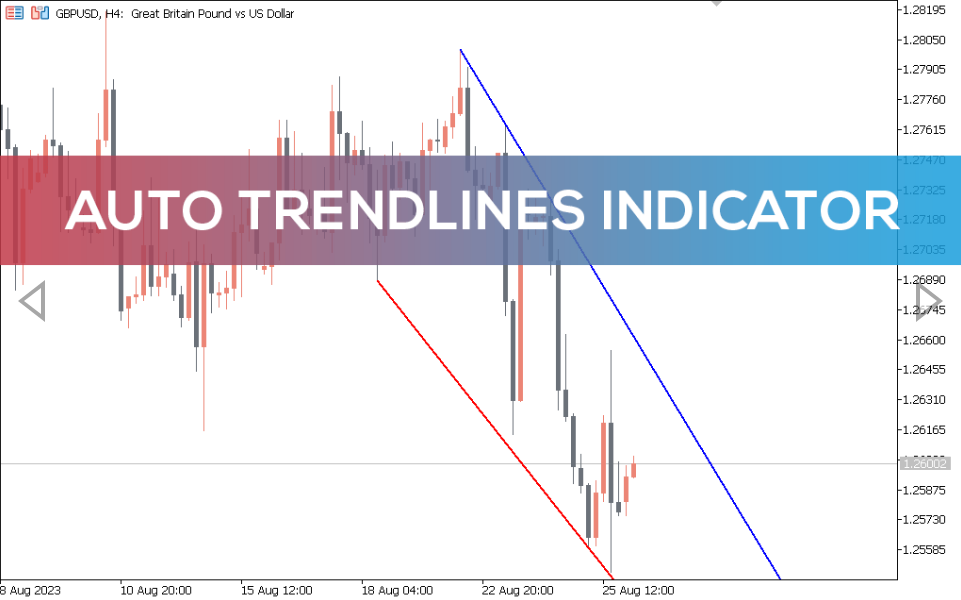
As the name suggests, the Auto Trendlines indicator displays trend lines on a chart. Usually in MT5 you need to go to the trendline tool and draw it yourself. But the indicator automatically plots these trendlines to determine the overall market trend.
It uses mathematical algorithms and price data to detect and plot trend lines. It scans historical price movements, identifies significant swing highs and lows, and then connects them with straight lines representing the main trend direction.
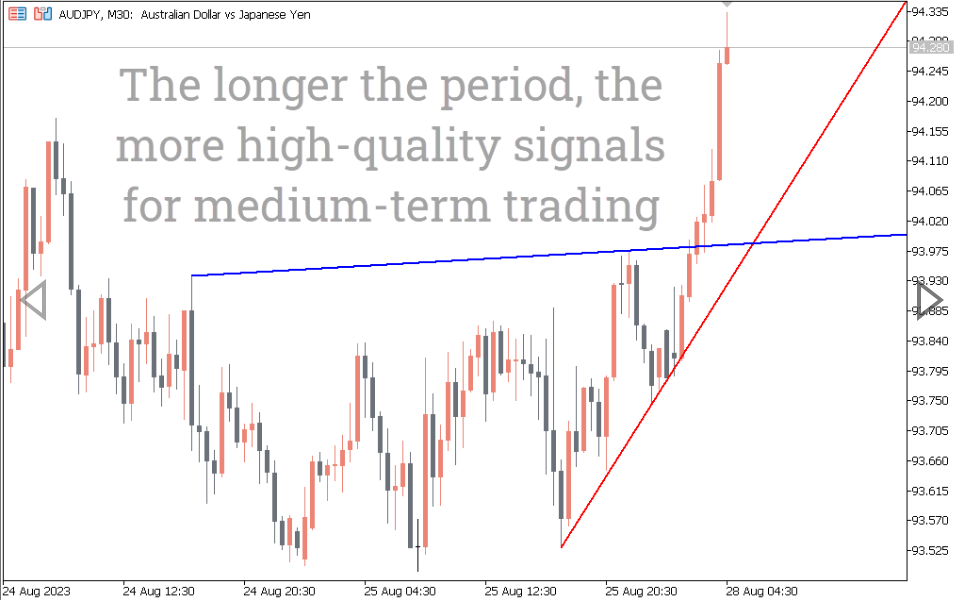
While you can use the indicator on all timeframes, it is better to look at the overall trend on longer timeframes.
How to use the Auto Trendlines Indicator for MT5?
The EUR/CAD H4 chart below shows the indicator.
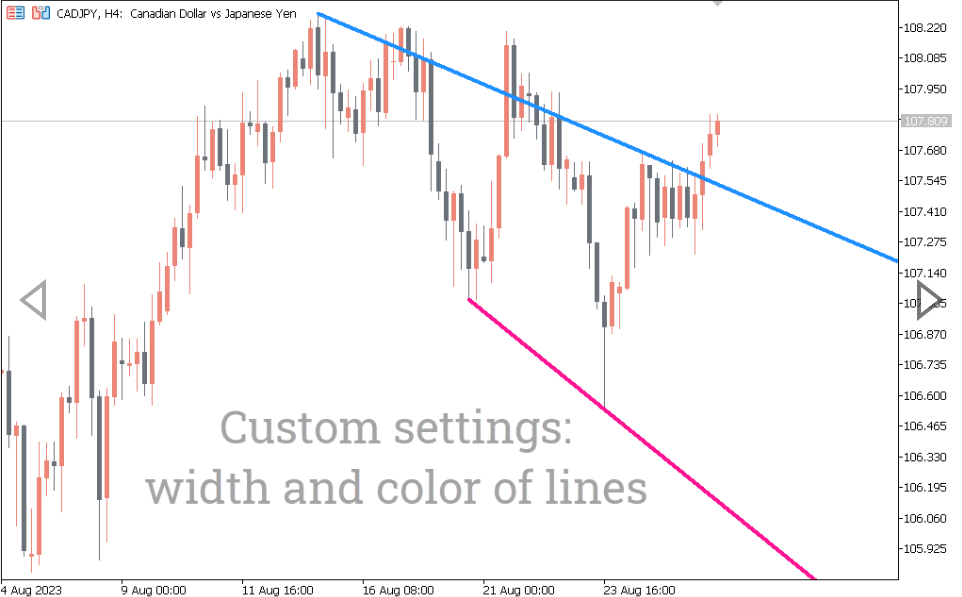
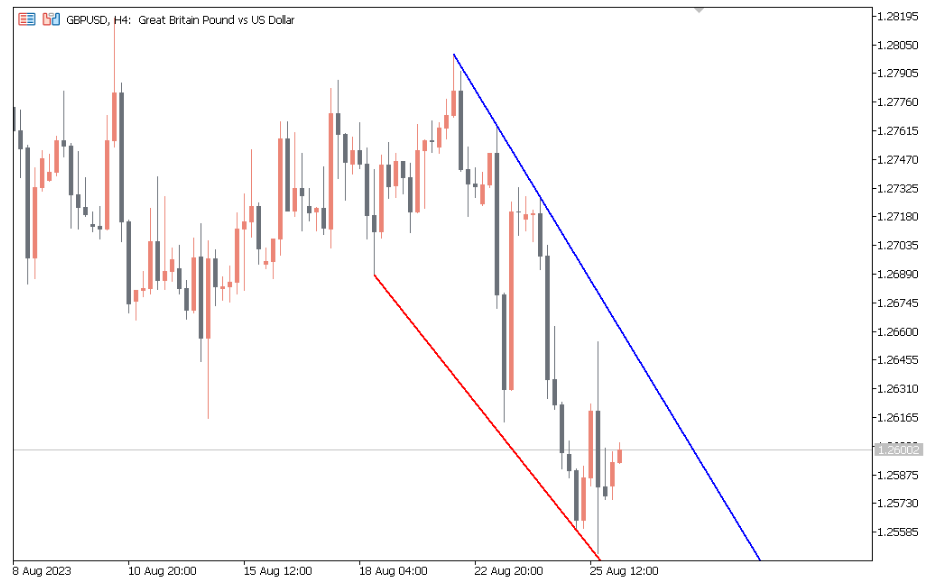
The indicator shows two trend lines; a bearish line in red and a bullish line in blue. If the red support line is sloping down, it indicates a downtrend. Conversely, if the blue resistance line is sloping upward, it indicates a bullish trend.
It is important to note that the bearish red line acts as a resistance level and the bullish blue line acts as a support level.
You can use the Auto Trend Lines indicator with other technical indicators such as moving averages to develop a trend line strategy.
Conclusion
The Auto Trendlines indicator for MT5 draws bullish and bearish trendlines. These lines act as support and resistance levels. By looking at the general trend, you can find continuation and reversal of the market.
Reviews
There are no reviews yet.
Be the first to review “Auto Trendlines Indicator” Cancel reply
We use cookies to ensure that we give you the best experience on our website. If you continue to use this site we will assume that you are happy with it.Accept


Reviews
There are no reviews yet.