Auto Trend Lines Forex Indicator for MT4MT5
What is Trend lines
A trend line is a straight line that connects two or more price points and is used to identify a current trend in a market. It is a simple yet powerful tool in technical analysis that helps traders to make sense of the market direction and to identify potential buying and selling opportunities. Trend lines are usually plotted on charts to connect a series of highs or lows, making it easy to identify the direction of the trend.
There are two types of trend lines:
Uptrend line: Connects the lows of the price action and is used to identify an uptrend.
Downtrend line: Connects the highs of the price action and is used to identify a downtrend.
A break above or below the trend line is considered as a possible indication of a trend change. So traders will often look for a price to break above or below a trend line, to signal a potential trade opportunity.
How it used in Forex Trading
In forex trading, trend lines are used as a technical analysis tool to identify the direction of the market and to make predictions about future price movements. By connecting two or more price points, trend lines can be used to identify an uptrend or downtrend, which can help traders to make decisions about when to enter or exit trades.
For example, if a trader sees an uptrend line on a currency pair’s price chart, they may interpret this as a bullish signal and choose to buy the currency pair. Similarly, if a trader sees a downtrend line, they may interpret this as a bearish signal and choose to sell the currency pair.
Traders also use trend lines to identify potential areas of support and resistance, which can be used as entry and exit points for trades. For example, if a currency pair is in an uptrend and is approaching a previously established uptrend line, a trader may interpret this as a potential area of resistance and look to take profits or exit a long position at that level.
Whom is Auto TrendLines indicator for?
Trend lines (TL) are a simple yet powerful tool in technical analysis that can be used to identify trends and make predictions about future price movements in the forex market. They are compatible with any indicator and trading system and can be used by both novice and experienced traders.
Novice traders can use trend lines to learn about market trends and how to draw trend lines on their own, while experienced traders can use the AutoTrendLines to quickly identify trend line options and save time in their analysis.
The techniques provided below will help traders to effectively analyze trend lines and apply them in their trading strategy.
How is Trend Lines Drawn by AutoTrendLines Indicator
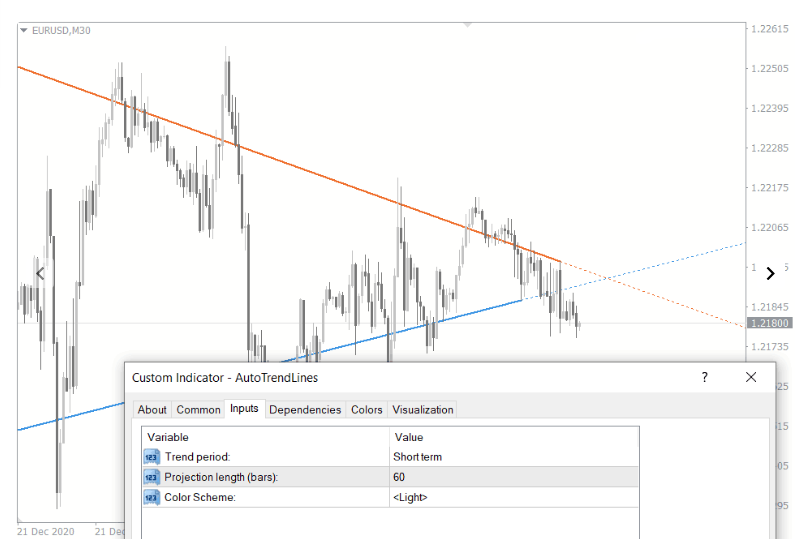
The Auto TrendLines indicator is designed to identify potential trend lines on a chart. It starts by locating all possible trend lines and then uses filters to eliminate those that do not meet certain criteria. The remaining lines are then evaluated for quality and the two best trend lines are displayed on the chart.
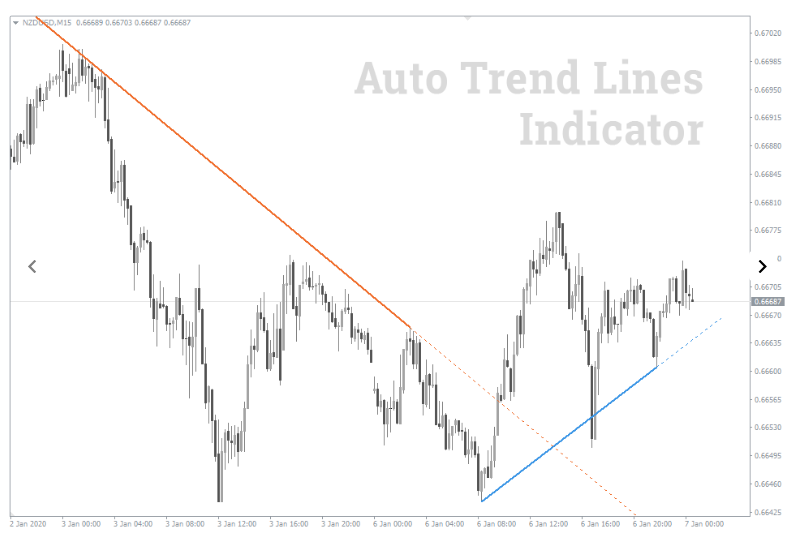
Thus, there can only be two lines on the chart at the same time:
Uptrend line (blue);
Downtrend line (orange).
Trend Projection
The solid line is the trend line that the Auto Trend Lines Indicatorwas able to determine, while the dotted lines represent the suggested direction of the trend continuation and potential points of interaction between the price and the trend line. The dotted line is also known as trend projection.
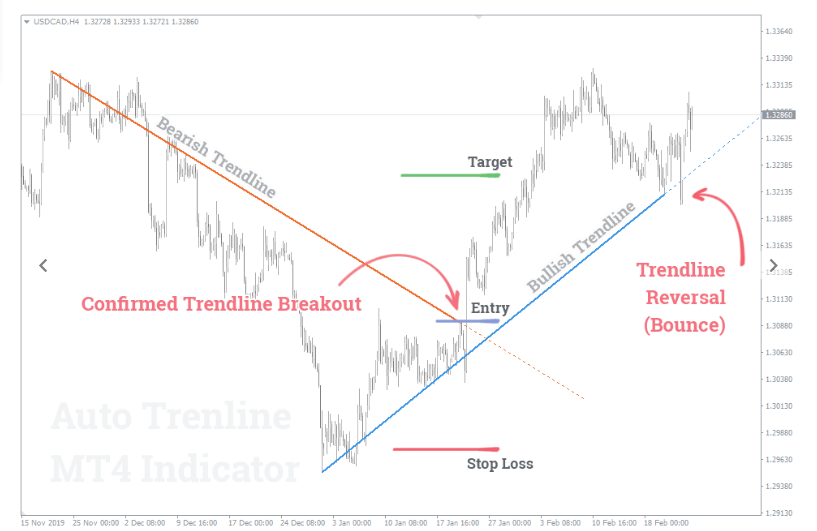
How to trade using the Auto Trend Lines Indicator?
Trading with trend lines can be broken down into two main methods:
Price bounce (reversal) from trend line;
Trend line breakout.
Rarely, trend lines are used as the price movement vector.
Price bounce (reversal) from trend line
You must have heard quite often the opinion that trading with the trend is the most successful. This strategy is based on the idea that the asset price tends to continue the trend movement, and a reversal is less likely.
Based on the logic above, it’s best to open a trade next time, when the price touches the trend line. By doing so, added to a potentially profitable trade, you’ll also get the optimal reward risk ratio.
The strategy of ““Price bounce from TL” implies,
Buy if the price has approached or touched the uptrend line;
Sell if the price has approached or touched the downtrend line.
The recommended strategy for placing stop-loss orders is to place it over/under the previous low by a sufficient number of points to avoid false breakout. Take profit can be placed at the lowest/highest price level within the range of the corresponding trend line or the distance equalling the height of the previous wave.
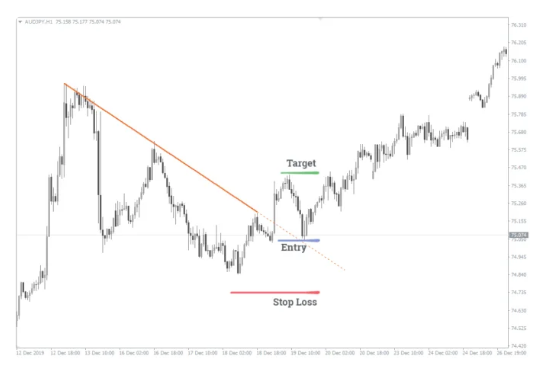
Trend line breakout
Eventually, all trend lines will be broken, but traders can still take advantage of this situation by using this strategy of trading when a trend line breaks out. This strategy is based on the idea that when a trend line is broken, it can indicate a change in the market trend and an opportunity for profit.
If the downtrend line has been broken, and the price has settled above it, you should consider buying if the price also touches the line again from the other side.
If the uptrend line has been broken, and the price has settled below it, you should consider selling if the price also touches the line again from the other side.
When using the both methods, the logic for placing stop-loss and take-profit orders is similar. For a buy trade, the stop-loss order should be placed below the lowest price level within the range of the considered trend line, while the take-profit order should be placed at the level of the highest price reached at the time of the trend line breakout. The same logic applies to sell trades but in reverse.
You must be logged in to post a review.

Copyright 2025


Reviews
There are no reviews yet.