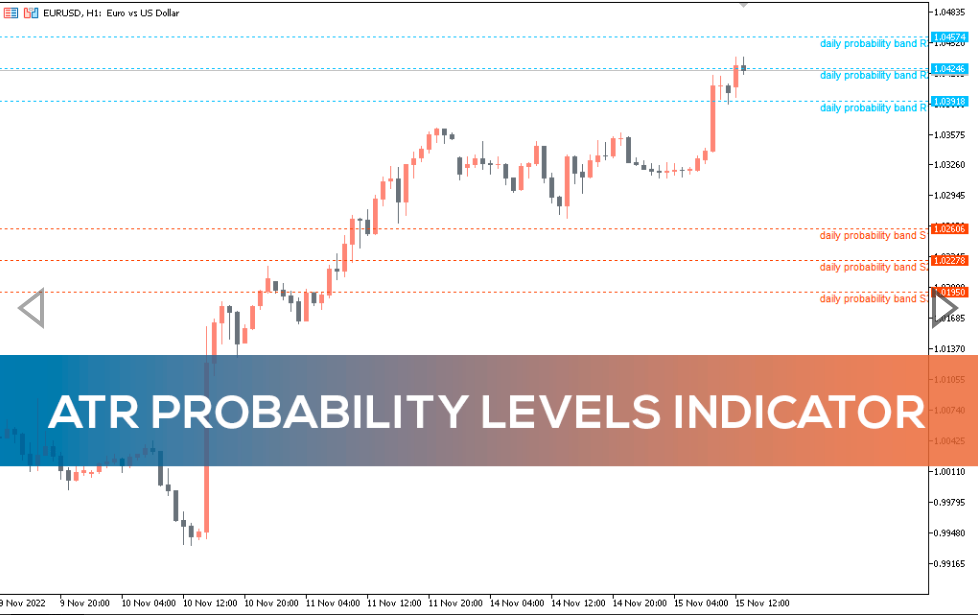
ATR Probability levels Indicator
Forex BUY and SELL signals from the best ATR Probability levels Indicator. Plots support and resistance levels for selected timeframe on the chart.
Categories: MT5, Levels, Informational
The ATR Probability Levels Indicator is an MT5 indicator that displays support and resistance levels to determine the direction of a trend. The traditional average true range indicator draws a simple moving average below the main window. The indicator draws two resistance levels and two support levels for trend direction.
The upper resistance level is called ATR(y) and the lower resistance level is called ATR(t). Conversely, the first support level is called ATR(y) and the second support level is called ATR(t).
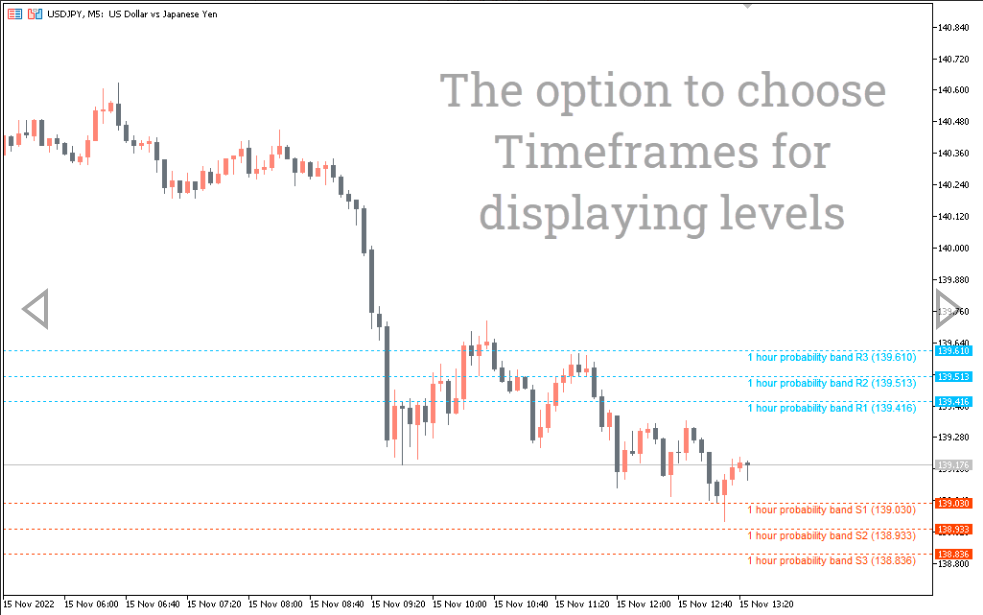
The indicator works best on longer timeframes as it can give false signals on smaller timeframes.
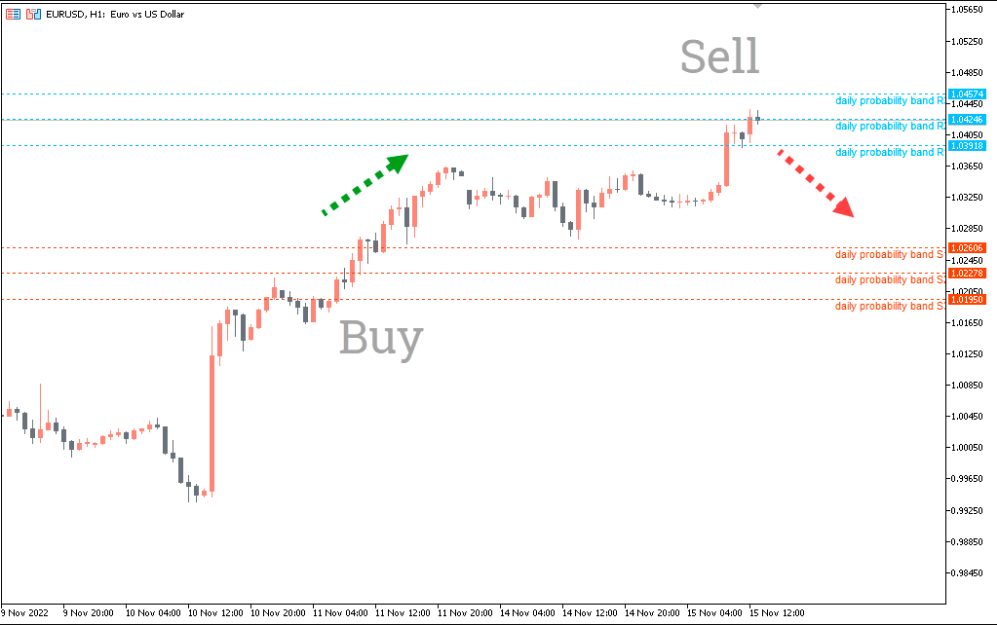
ATR Probability levels Indicator BUY/SELL signals
The EUR/USD chart above shows BUY and SELL signals with the ATR Probability Levels indicator. To identify BUY and SELL signals, traders must look for support and resistance levels. When the price rises above the upper resistance levels, it indicates a strong downtrend. Here, traders can enter short positions or exit long positions.
Conversely, when the price approaches the first support level, it is a sign of an uptrend and traders may enter long positions. Traders should wait for the price to move up or down before opening positions. Traders can also apply the indicator with other indicators such as RSI or MACD to further confirm the signal.
Conclusion
The ATR Probability Levels indicator draws two support levels and two resistance levels to show the direction of the trend. Through these levels, traders can open long or short positions. In addition, you can download the Indicator for free from our website.


Reviews
There are no reviews yet.