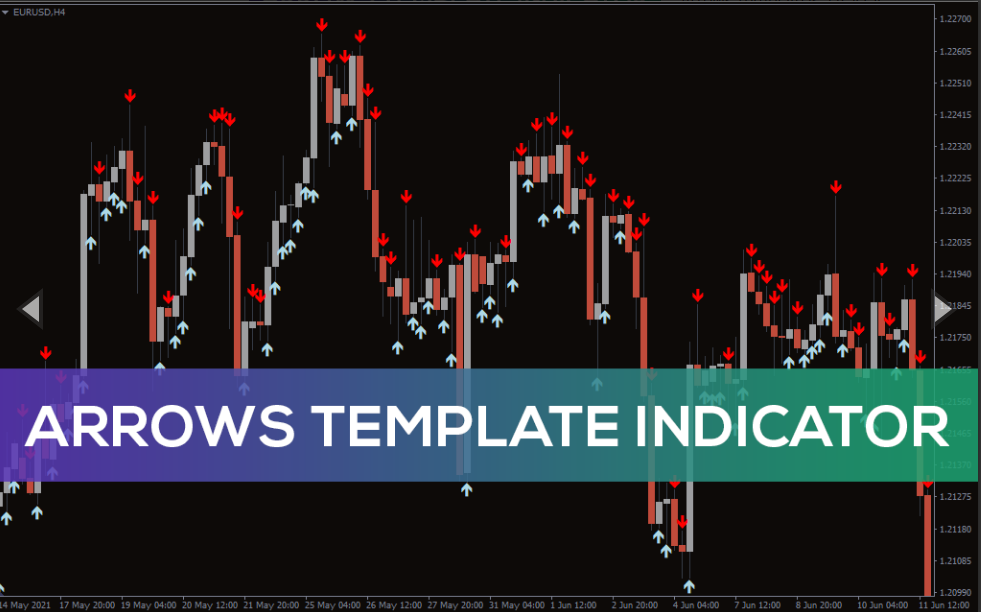
Arrows Template Indicator
Arrows Template is a fractal indicator, used to spot potential price swing levels on MT4 charts. Works best for pullback and trend-following trading strategies.
The Arrows Template is a price swing indicator for MetaTrader 4 (MT4), used to help identify critical price reversal points. It compares the open/close of the price candles and plots arrow signals showing real-time market momentums.
This indicator is a suitable match for forex and stock day traders. It continuously monitors the changes in price dimensions. So, you have a clear overview of the current trend condition whenever you look at your MT4 chart. Besides expert professionals, novice traders will also find this tool extremely useful because of its simple demonstration of market sentiments.
Arrows Template suits all MT4 timeframes, enhancing your MTF chart analysis outcomes. Besides forex and stocks, it also works for cryptocurrencies, commodities, futures, etc.
In this guide, you’ll learn how to apply the Arrows Template signals for identifying solid bullish/bearish price reversal patterns.
How to anticipate precise buy-sell signals by using the Arrows Template in MT4
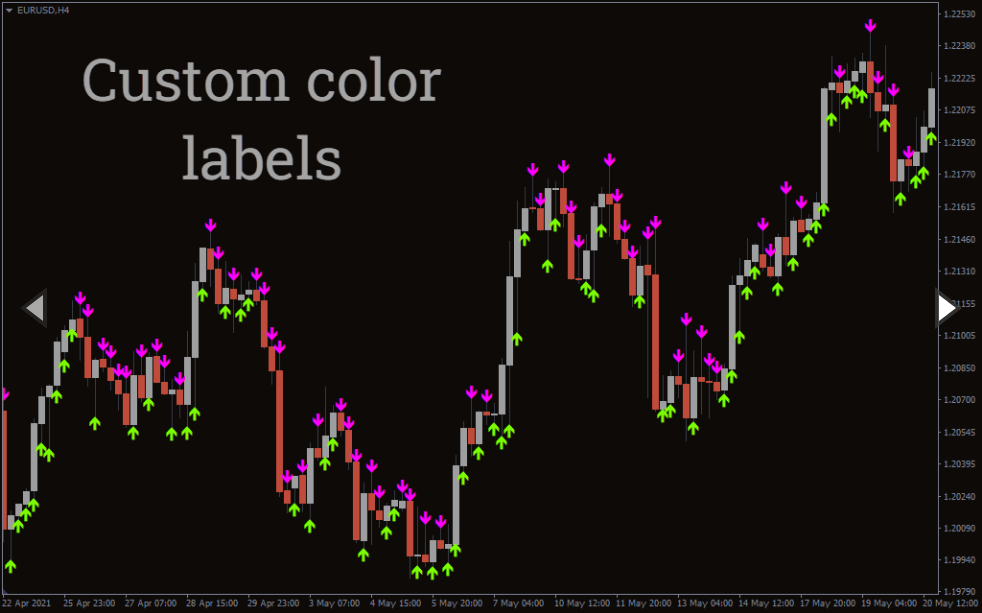
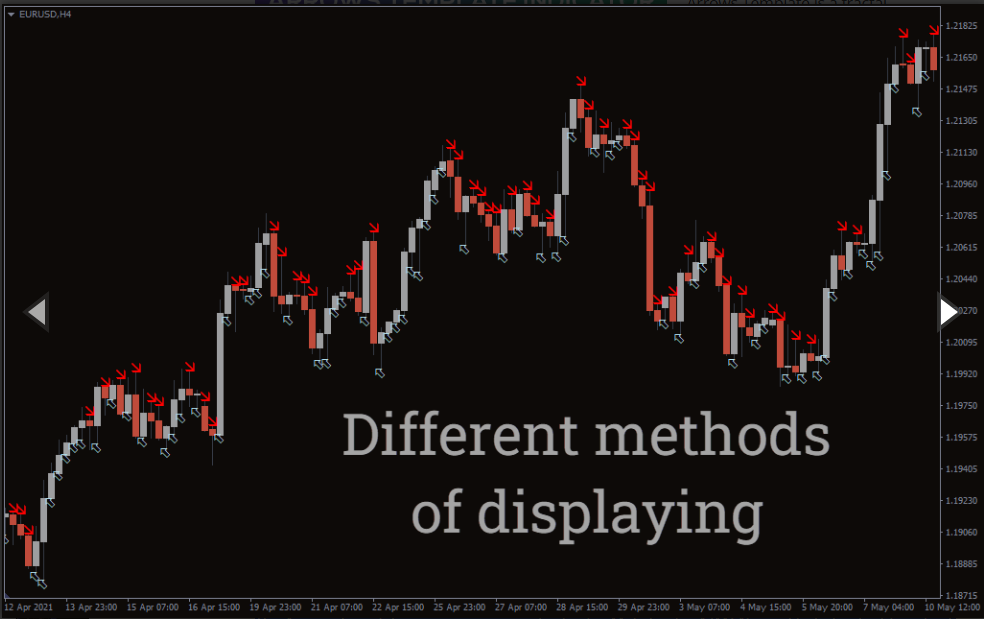
Arrows Template plots the up/down arrows based on the comparison of closing prices between the current and the prior candle. The indicator plots an up arrow (light blue) when the current candle finishes higher than the closing price of the previous candle. Oppositely, you’ll find a down arrow (red) above the price candle high when the current price closes lower than the last candle’s close.
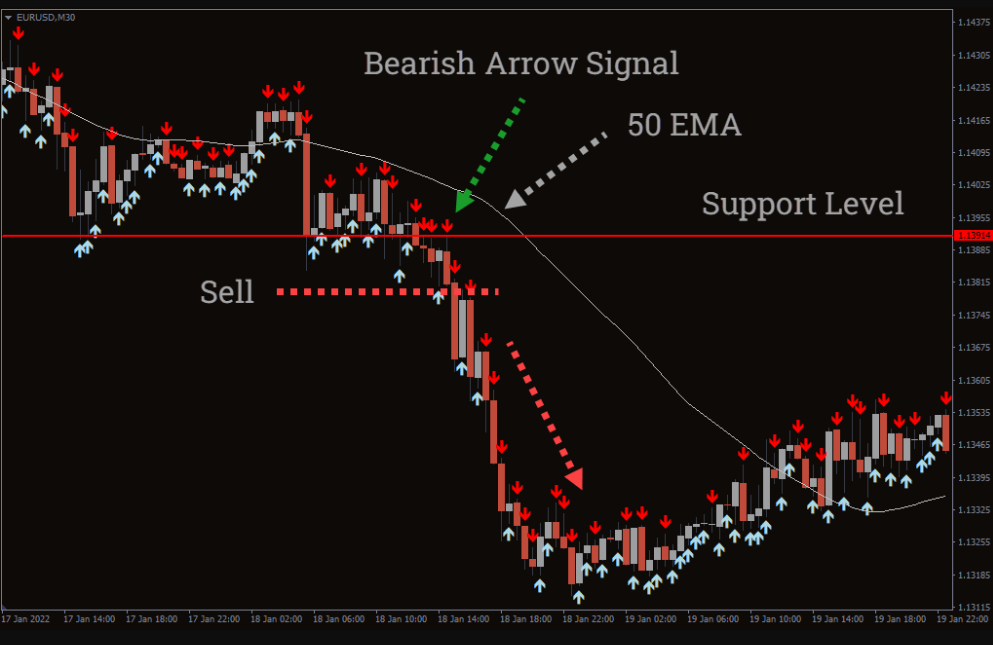
The structure of price bars or candles directly reflects the market sentiment. For instance, a bearish pin bar indicates sellers have managed to outbid buyers by forcing Bthe price lower than the previous candle close. In such conditions, we’ll only look for sell signals following the current bearish sentiment reflected in the chart.
In the above example, we’ve added a horizontal support line and a 50-day moving average along with Arrows Template forming a trend-following strategy. The price held below the 50 EMA, indicating a bearish trend condition. When it broke below the immediate horizontal support, the Arrows Template started plotting a series of down arrows confirming a strong bearish sentiment behind the current downtrend rally. So, we can place a sell order right after the break of the horizontal support.
Moreover, you may consider a trade exit whenever the price rejects a key support/resistance level, and the indicator generates an opposite arrow signal to your entry.
Conclusion
Arrows Template works as an automatic MT4 price chart analysis tool that helps traders monitor the periodic changes in market sentiments. Also, it assists beginners in reading the price candles correctly. However, you cannot use it as a sole indicator for anticipating buy/sell signals. Consider using it alongside other price-action tools like support/resistance, moving average, and trendline indicators. Alternatively, you can merge Arrows Template with your existing trend or swing trading strategy to improve your decision-making.
You must be logged in to post a review.

Copyright 2025
Reviews
There are no reviews yet.