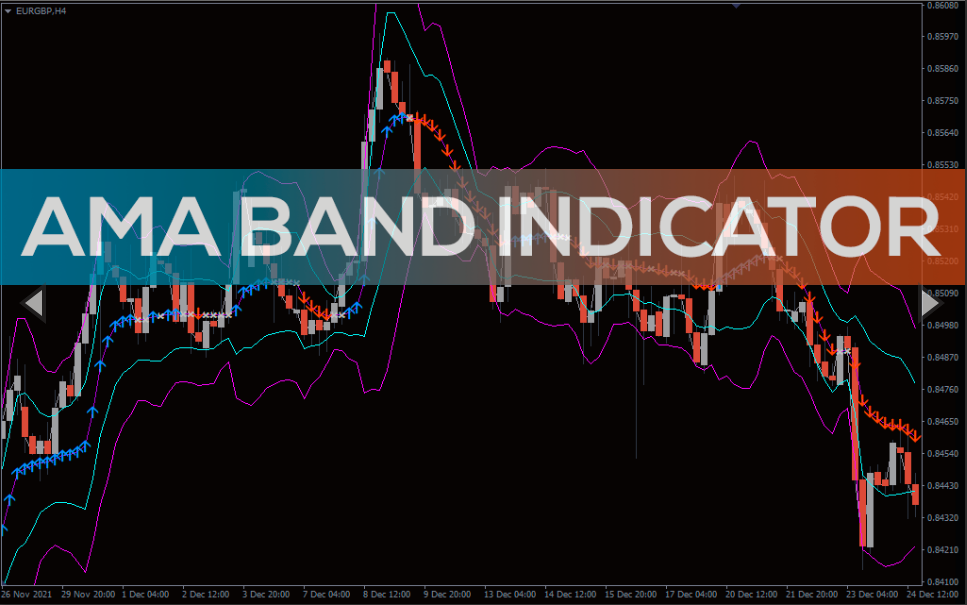
AMA Bands Indicator\
Best volatility indicator. Trend reversal indicator. Forex technical indicator. Support and resistance indicator.
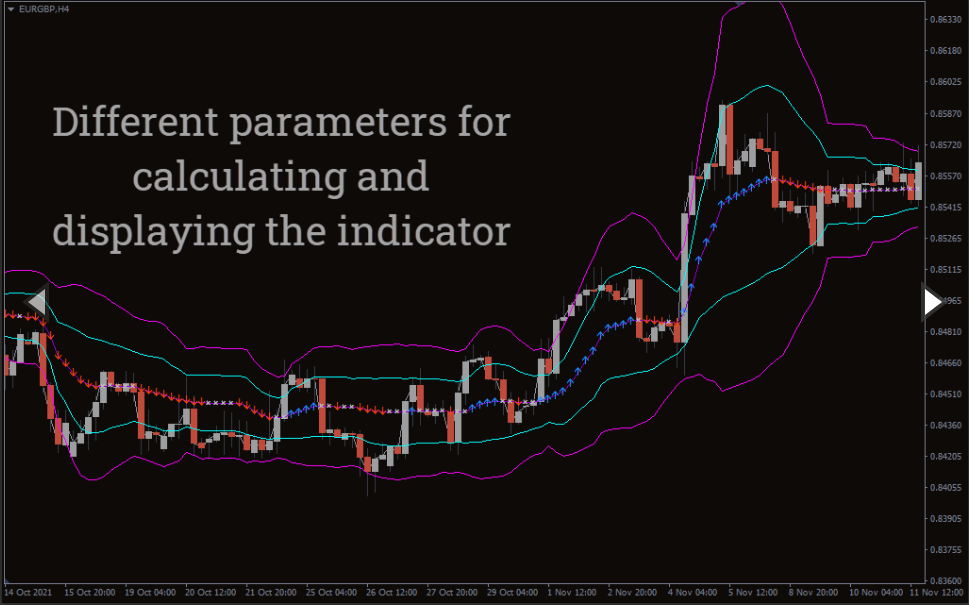
The Adaptive Moving Average, otherwise known as the AMA Bands indicator for MetaTrader is a trend following indicator. It is an innovative forex trading tool that tracks the historic data of the price to spot levels where the price has the potential to reverse or continue trending.
The indicator is designed with signal arrows and a band of moving averages that encloses the movement of the entire price. The expansion/contraction of the outer bands of the moving averages act as a gauge to measure the increase/decrease of the market’s volatility. The bands also act as some form of dynamic support and resistance.
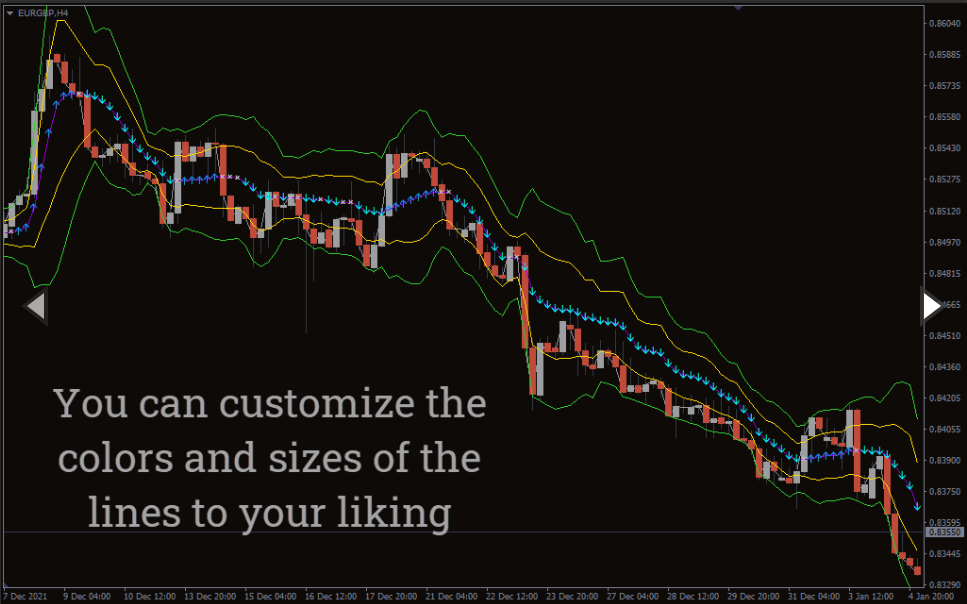
This technical indicator is optimized for different trading techniques like scalping, day/intraday, and swing trading. Besides, the indicator is also chart-friendly and the signals are very easy to interpret, which makes it suitable for a beginner. A professional trader would most likely find it very handy as a confluence before making a trading decision.
AMA Bands Indicator BUY/SELL Signals
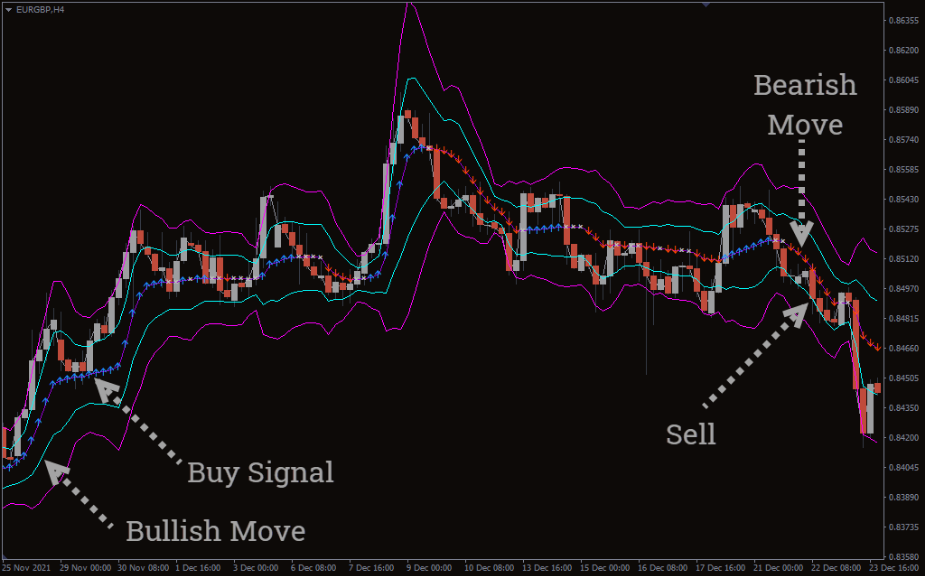
The above screenshot shows how the AMA Bands indicator would look on your trading chart. It also depicts how to identify good BUY/SELL trade setups. The indicator isn’t recommended to be used in isolation. It should rather be used in synergy with other trading indicators or price action.
The AMA Bands indicator paints a dodger-blue signal arrow once it identifies a potential bullish move. Similarly, it paints an orange-red to depict a possible bearish trend. With these arrows, you can quickly identify the bias of a trend and wait for a BUY/SELL opportunity.
BUY Setup: Firstly, wait for the dodger-blue arrow to appear on your chart, and also wait for the price to close above the middle band. After these two conditions are met, you may then open a BUY/LONG position in sync with price action.
SELL Setup: Wait for the orange-red arrow to be printed on your chart, and also wait for the price to close above the mid-band. After these two conditions are met, you may open a SELL/SHORT trade sync with price action.
The above BUY signal (refer to the screenshot above) becomes valid after the price formed a bullish engulfing pattern. The same principle was also applied to the SELL setup. Remember to keep your Stop Loss and Take Profit realistic as no indicator is a holy grail. Don’t wait for the opposite signal before exiting a trade.
Conclusion
The Adaptive Moving Average Bands indicator for MT4 is a great trading tool you may consider adding to your chart. It can improve your winning trades when combined with price action. What’s more, the indicator is free to download
You must be logged in to post a review.

Copyright 2025

Reviews
There are no reviews yet.