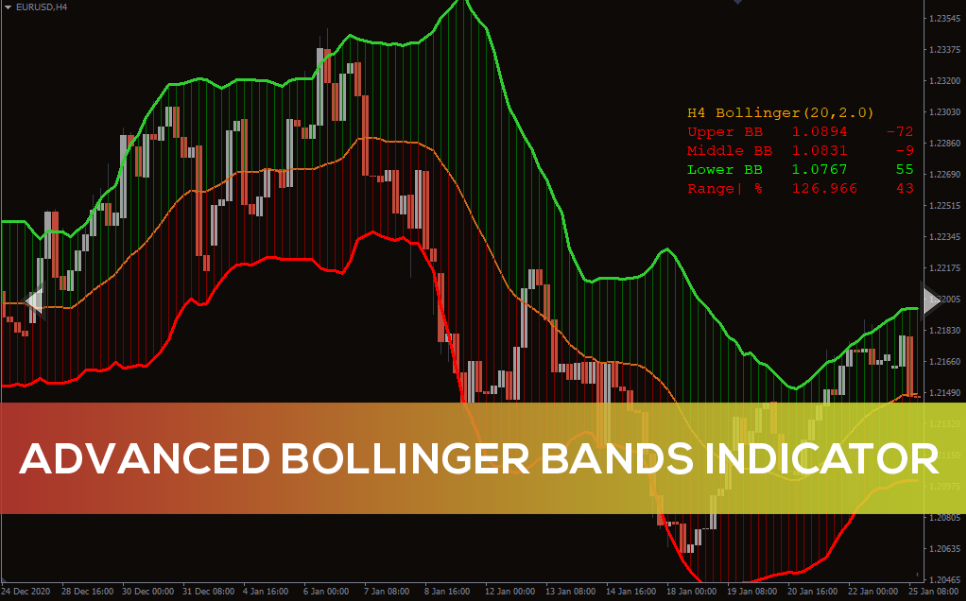
Advanced Bollinger Bands Indicator
Best Advanced Bollinger Bands indicator for identifying intraday BUY SELL signals in MT4. Points overbought/oversold positions of the price. Compatible with MTF charts.
The Advanced Bollinger Bands is trend-following forex and stock trading indicator that helps traders identify accurate buy/sell zones. Unlike regular Bollinger bands, this indicator plots a clear demonstration of the dynamic trendlines alongside overbought/oversold levels.
Technically, indicator points to both trend continuation and reversal positions. These features allow traders to go for trend-following and swing trading simultaneously.
Furthermore, the Advanced Bollinger Bands also suits futures, metals, energy, and cryptocurrency trading apart from forex and stocks. Consequently, this indicator allows you to trade any financial assets available within your Metatrader 4 platform.
This guide explains the most effective technique for determining buy-sell signals using the Advanced Bollinger Bands indicator in MT4, including chart examples.
How to trade using the Advanced Bollinger Bands indicator in MT4
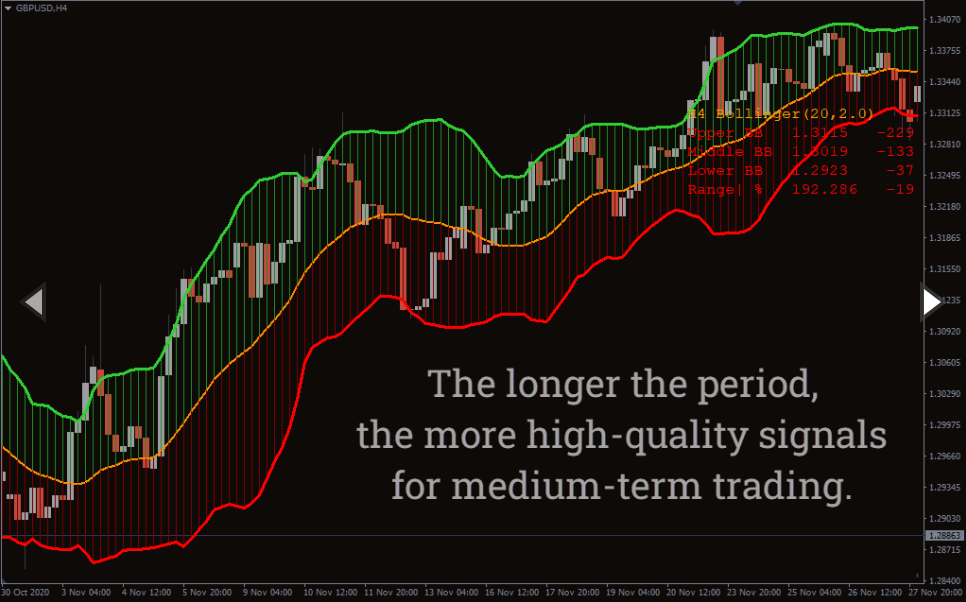
The green bars above the mid-Bollinger bands portray the buy zone. Conversely, the red bars at the bottom of the bands show the sell zone. While looking for a trend-following entry, we need to assess the price’s intention of staying in the green or red zone of the Bollinger bands.
As we can see in the above example, the price was initially held inside the red zone, indicating a downtrend market. However, the price entered the buy zone but was rejected by the sellers from the higher Bollinger bands. Later, the price breaks the mid-band and triggers a sell entry, assuming the market will rejoin the recent bearish rally.
We’ll use the higher Bollinger band as a stop-loss position while going short. Also, we’ll hold our sell positions until the price breaks above the mid-band. Alternatively, you can go for a manual exit if the trade already earns your targeted risk to reward ratio.
While entering long, consider a bullish breakout at the mid-band during an uptrend market condition. Set the stop loss below the lower Bollinger band and hold the long position until the price enters the selling zone.
Conclusion
The Advanced Bollinger Bands offer a simple demonstration of market trend status, which is easy to read and follow. Besides identifying market momentums and trend conditions, it also helps measure price volatility levels. Moreover, it specifies potential stop-loss and take-profit areas besides anticipating precise buy/sell positions.
You must be logged in to post a review.

Copyright 2025

Reviews
There are no reviews yet.