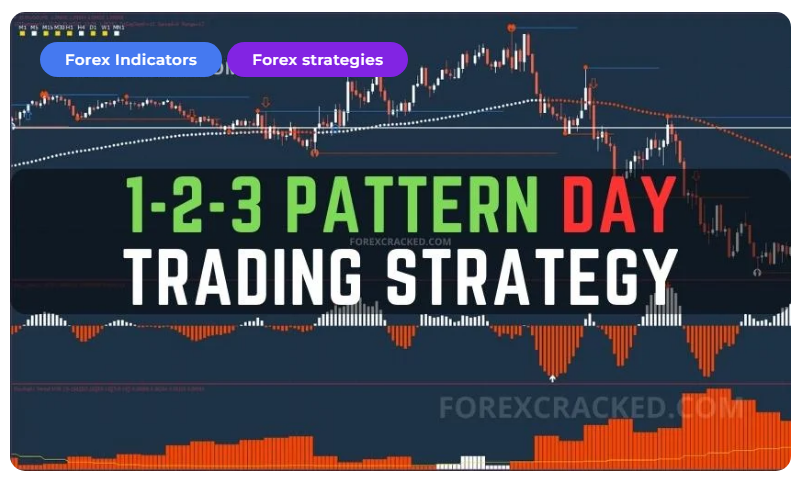
1-2-3 Pattern Day Trading Strategy
Indicators Used in this Day Trading Strategy
The system uses several indicators, including the Day Signal Arrow, Day Open Line, Day Signal Ultra, Day Bar, Day Look, Day Explosion, and the 1-2-3 Pattern V6. These indicators work together to help traders discern the correct market direction near support and resistance zones.
These are the main indicators used in this strategy to determine entries. But the system does come with an additional indicator, so you can experiment with filtering the signals further.
1-2-3 Pattern V6
This indicator provides Blue and Orange buy-sell arrow signals and is integral to the strategy as it determines the entry signal. This Day Trading Strategy other indicators help filter out less profitable arrow signals from this indicator.
Day Signal Ultra
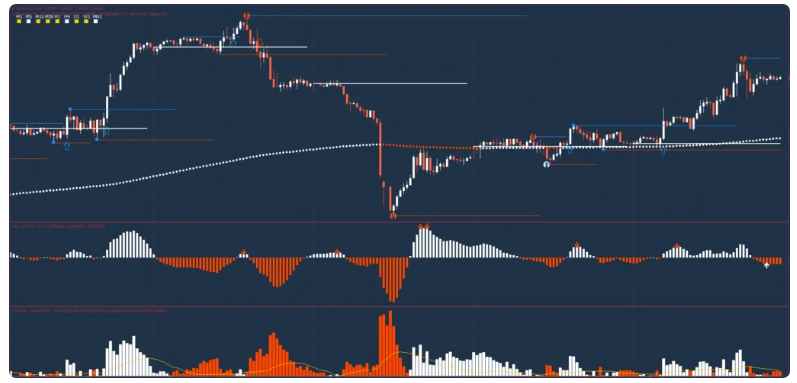
Day Signal Ultra serves as a color-changing EMA 190. The color of this ribbon changes to white when the price is above the Day Signal Ultra. Conversely, the ribbon turns Orange when the price falls below the Day Signal Ultra. The slope of the Day Signal Ultra is crucial for identifying the trend’s strength. When the price is above the indicator, and the slope is ascending, traders should consider long trades. On the other hand, short trades are advisable when the price is below the Day Signal Ultra, and the slope of the indicator is descending.
Day Look
Day Look is another trend-following indicator that charts a histogram based on the difference between long-term and short-term moving averages. If the histogram falls below the zero line, it signifies a downtrend in prices, while a histogram above the zero line indicates an upward trend in prices.
Day Explosion
Day Explosion is essentially a renamed Waddah Attar Explosion indicator with an appealing color scheme. It operates on multiple time frames and demonstrates trend strength, explosion power, or momentum. The histogram color changes to white when the trend is upward, while downward trends turn the bars to Orange. The indicator also plots an explosion signal line which functions as a momentum threshold, providing valuable data for any currency pair across all time frames.
This 1-2-3 Pattern Strategy can give you trading signals you can take as they are or add your additional chart analysis to filter the signals further, which is recommended. While traders of all experience levels can use this system, practicing trading on an MT4 demo account can be beneficial until you become consistent and confident enough to go live.
Trading Rules for 1-2-3 Pattern Strategy
Remember to tighten your Stop Losses around High Impact News Releases or avoid trading at least 15 minutes before and after these events when using this 1-2-3 Pattern Strategy.
As always, to achieve good results, remember about proper money management. To be a profitable trader, you must master discipline, emotions, and psychology. It is crucial to know when and when not to trade. Avoid trading during unfavorable times and market conditions like low volume/volatility, beyond major sessions, exotic currency pairs, wider spread, etc.
Trades only in the direction of the trend.
Uptrend: price above White dots of Day signal ultra indicator.
Downtrend: price below Orange dots of Day signal ultra indicator.
Buy Entry
123 pattern V6 Blue buy arrow.
Day signal ultra indicator White dot.
Day look indicator White bar.
Day explosion White bar above Yellow line.
Sell Entry
123 pattern V6 Orange sell arrow.
Day signal ultra indicator Orange dot.
Day look indicator Orange bar.
Day explosion Orange bar above Yellow line.
Trade Exist
Any positions with this Day Trading Strategy can be liquidated using a fixed profit target. Alternatively, the profit target should be set using previous support, resistance, or high-low level as a reference point. You may also exit the trade manually if the system conditions reverse.
Initial stop loss 5-10 pips above/below the signal bar depends on the time frame.
Profit target M5 7- 12 pips, M15 8-15 pips, M30 15- 25 pips.
It is recommended to use a stop loss. Set SL below the entry price using previous support/resistance as a reference point Or on the previous high/low swing. Using fixed stop loss settings without any reference points is not advocated.
You must be logged in to post a review.

Copyright 2025
Reviews
There are no reviews yet.