Color RSI Indicator
Color RSI indicator for MT5 provides forex BUY and SELL trading signals based on overbought oversold RSI levels.
The Color RSI indicator for MT5 is a modified version of the classic RSI indicator – Relative Strength Index. Changes include adding price signals and BUY and SELL trading signals to the chart. In addition, the color of the oscillator has been adjusted to reflect the overbought and oversold conditions of the market. Thus, forex traders can use the oscillator color BUY and SELL signals for successful trading. The indicator works well for beginners and experienced forex traders. Moreover, the indicator works well on all intraday price charts as well as daily, weekly and monthly charts. In addition, forex traders can download the indicator for free and install it easily.
Color RSI indicator for MT5 trading signals
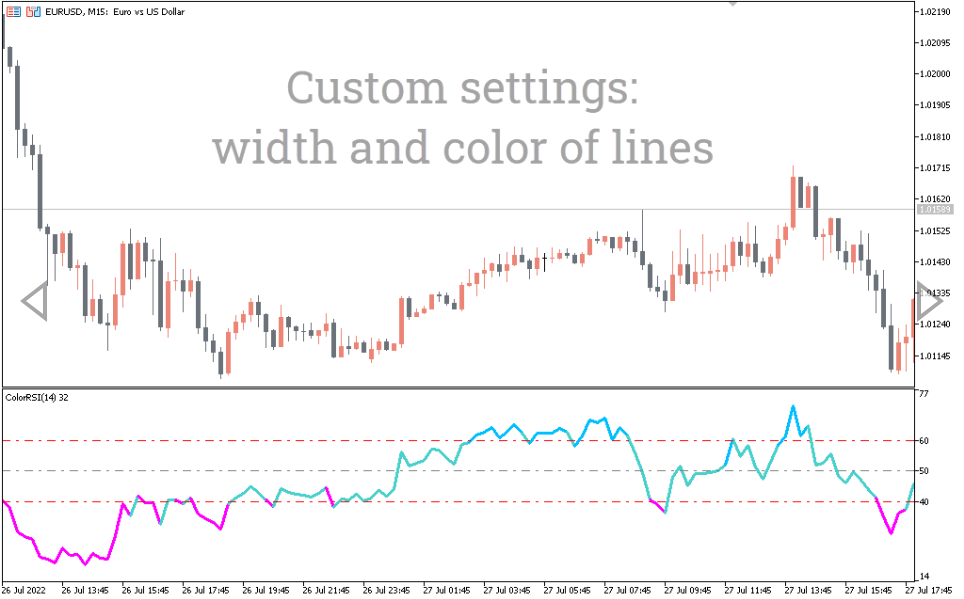
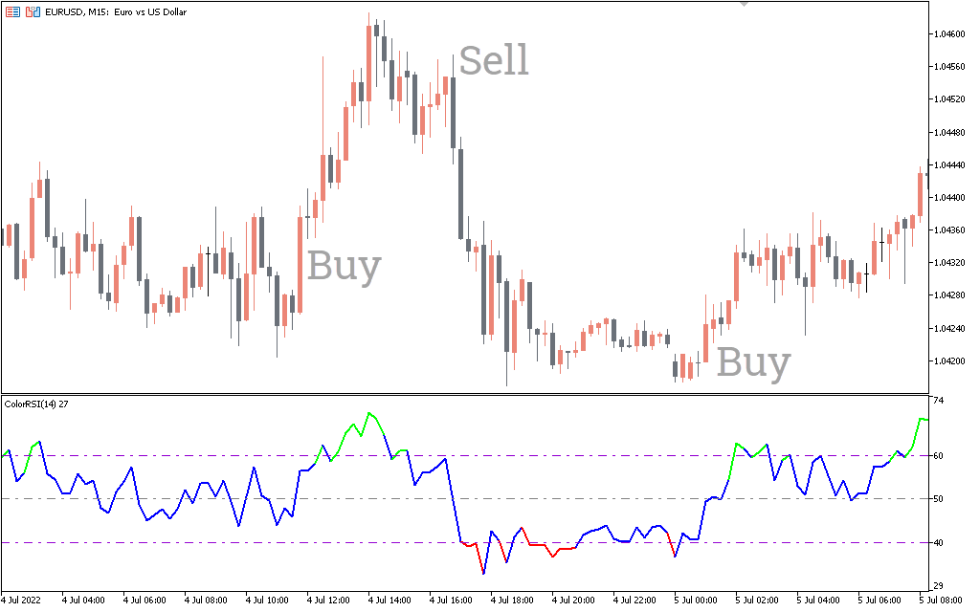
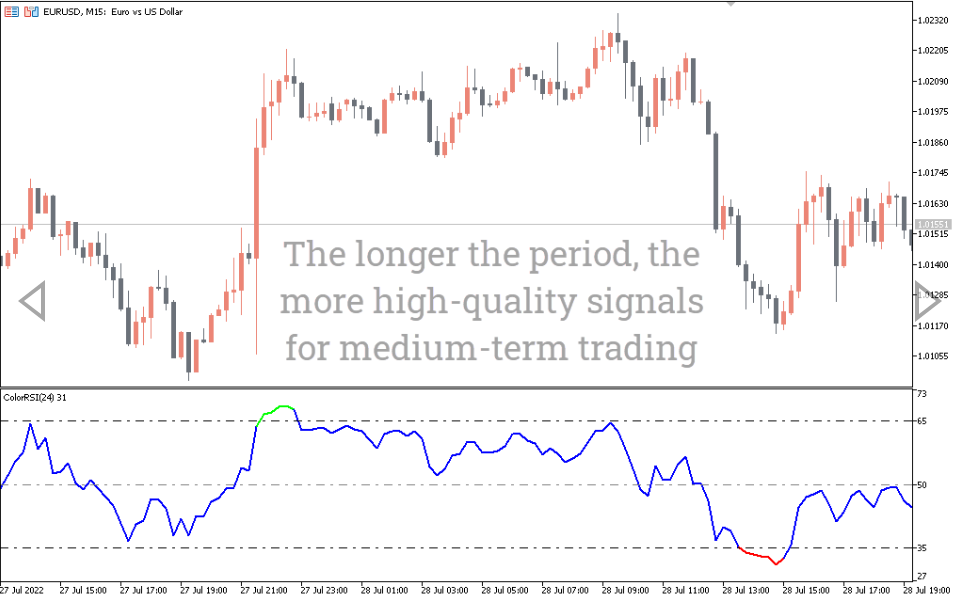
The EURUSD M15 daily price chart above shows the Color RSI indicator for MT5 in action. The indicator displays in the RSI indicator oscillator window shows the oversold area in red, and the overbought area in green. At the same time, the oscillator between the oversold and overbought zones is Color blue. The RSI indicator becomes oversold as soon as the indicator values fall below 40. The indicator changes color to red and signals a potential bullish reversal and changes the color of the indicator. Thus, forex traders can enter the market with a BUY position with a stop loss below the previous swing low. The best trading strategy is to take profits when the trading signal is opposite or when the risk/reward ratio is excellent above 1:2. Similarly, if the RSI rises above 60 and becomes oversold, the indicator signals a potential bearish price reversal and turns green. Thus, traders should place a SELL trade with a stop loss above the previous swing high. Forex technical traders should hold positions until the opposite trading signal or until the values of the oscillator go into the overbought area, helping the trader to go through the entire trend. However, forex traders may apply additional technical strategies or candlestick patterns to look for a profit-taking strategy. Since traders can apply the indicator on all charts, this indicator works well in downward technical analysis. Thus, traders can use the indicator on a higher time frame to determine the direction of the trend. At the same time, using charts with lower time frames, you can determine the best entry and exit points.
Conclusion
The Color RSI Indicator for MT5 helps technical Forex traders overcome the lack of warnings and arrow trading signals of the classic RSI indicator, the Relative Strength Index.
You must be logged in to post a review.

Copyright 2025

Reviews
There are no reviews yet.