Cap Channel Trading Indicator
Ideal tool for detecting price reversals and getting accurate buy and sell signals.
As the name implies, the CAP channel trading indicator is used for channel trading. In other words, it uses an envelope strategy where the price generally falls within a channel bounded by an upper and lower line. The upper channel acts as an overbought area, while the lower channel acts as an oversold area.
The indicator is volatility sensitive, meaning that it assesses the day-to-day price differences of an instrument to determine the demand and supply areas. Using this indicator shows you where to enter the market. It also helps determine whether to hold or exit the market altogether. The indicator post arrow signals indicate trend reversal points enabling traders to take advantage of trading opportunities.
You can use the indicator to trade any currency pair or instrument. The indicator also works perfectly for long-term or short-term trading strategies on the 15 minute or higher timeframes.
How to Open Buy and Sell Signal Using the Indicator
Buy Signal
Wait for the price to find support at the lower band
Buy when a red cross appears. Consider entering the trade at the close of the bullish candle or candlestick pattern
Place your stop loss below the recent swing low
Exit when the price reaches the upper band of the indicator plots a blue cross
Sell Signals
Wait for the price to find resistance at the upper band
Sell when the indicator plots a blue cross indicating a market reversal
Place your stop loss above the recent swing high
Exit when the price touches the lower channel line or the indicator posts a red cross
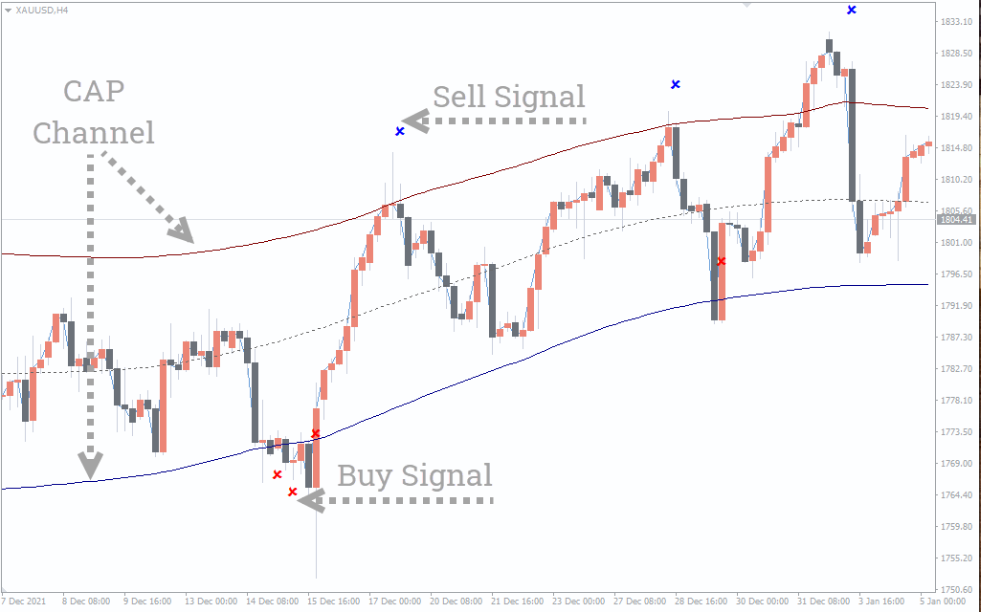
Real Market Example
The chart shows price movement for gold against the US dollar. Notice how the price follows the CAP channel bounded by the blue and red lines. The red line acts as an overbought area, while the blue line acts as an oversold level.
When the price touches the red line, it is a tell-tale sign of an impending downtrend. In fact, the indicator posts a blue cross, as shown in the picture. Similarly, a buy signal occurs when the price reaches the blue line, which acts as an oversold area. This indicates that the price is ready for a reversal to an uptrend. The indicator shows a buy signal by posting a red arrow.
Conclusion
CAP Channel trading indicator is an ideal tool for traders who use the channel trading strategy. The indicator maps the price charts factoring in the price volatility and plots an envelope within which the price usually ranges. As a trader, you only have to wait for the price to touch the channel line, post red or blue crosses, and exit when the indicator touches the opposite channel line. It is a tool that every trader should consider using.
You must be logged in to post a review.

Copyright 2025
Reviews
There are no reviews yet.