Bollinger Bands Color Indicator
Best breakout indicator for MT5. Bollinger bands Color indicator for МТ5 – One of the best trend indicator.
The Bollinger Bands Color indicator for MetaTrader is a powerful trading indicator for tracking market volatility. It is an invaluable tool for testing trends, breakouts and bounces in the market.
The indicator bars are plotted with standard deviation to measure market volatility. They expand and contract as price volatility increases and decreases.
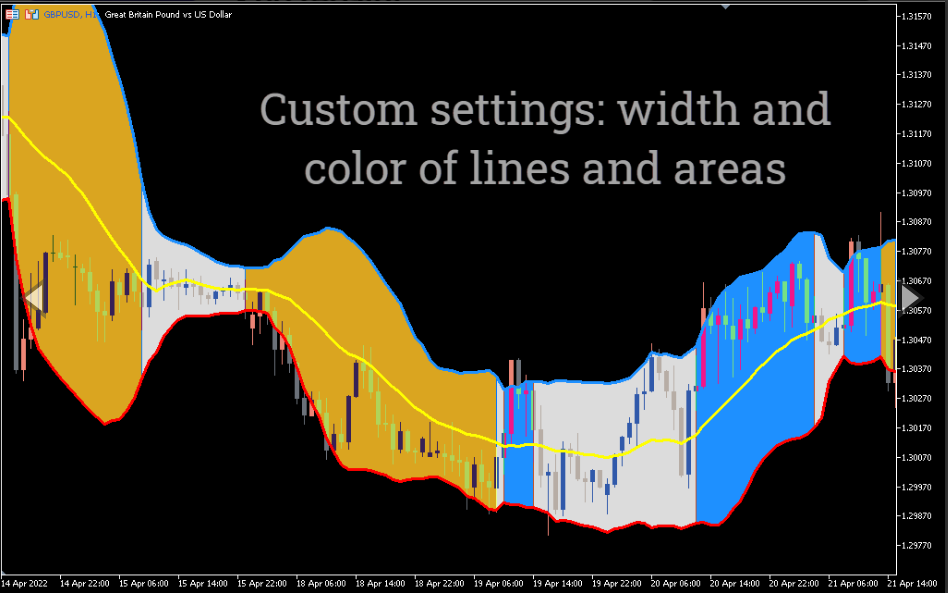
This color-coded MT5 indicator is displayed in the main chart window and consists of a moving average plus an upper and lower band. The values of the upper and lower bands are derived from standard moving averages.
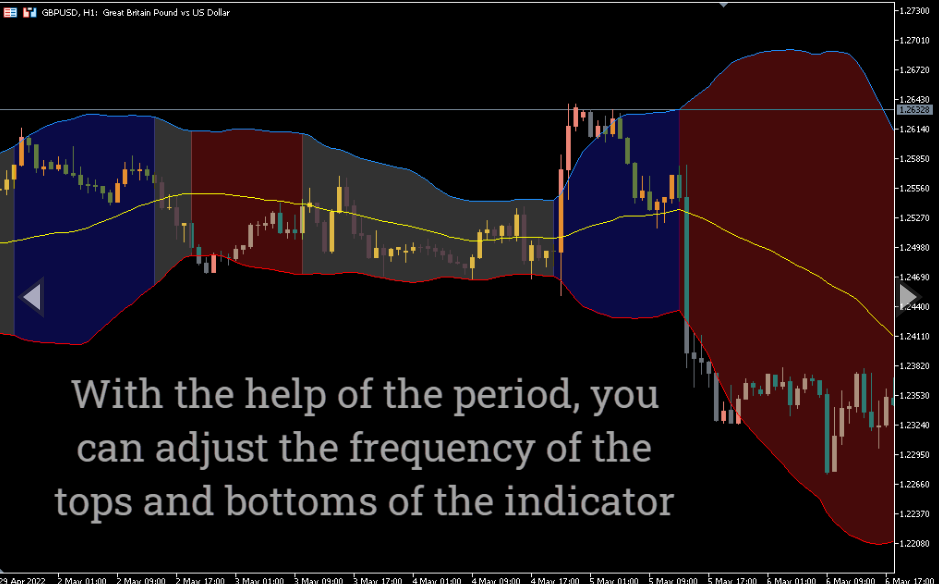
The indicator shows various market conditions that can be traded or avoided. For example, high volatility in the market is characterized by an explosive expansion of the upper and lower bands.
Conversely, low market volatility is represented by a narrow band. Therefore, you will know when to start looking for BUY/SELL or exit opportunities.
So the Bollinger Bands Color Indicator for MT5 helps you identify viable trading opportunities and exits based on the information displayed.
How To Trade With The Bollinger Bands Color Indicator
The Bollinger Bands Color indicator is universal and can be integrated into various trading strategies. It can be used to trade market conditions such as trend, ranges, bounces and breakouts.
This makes it a suitable trading tool for various trading plans – daily, intraday or swing. Professional and novice traders will also find it valuable due to its simplicity and high accuracy of making trades.
The color of the outer bands changes between blue and red in accordance with market sentiment. While the moving average located between the bands is light blue in color.
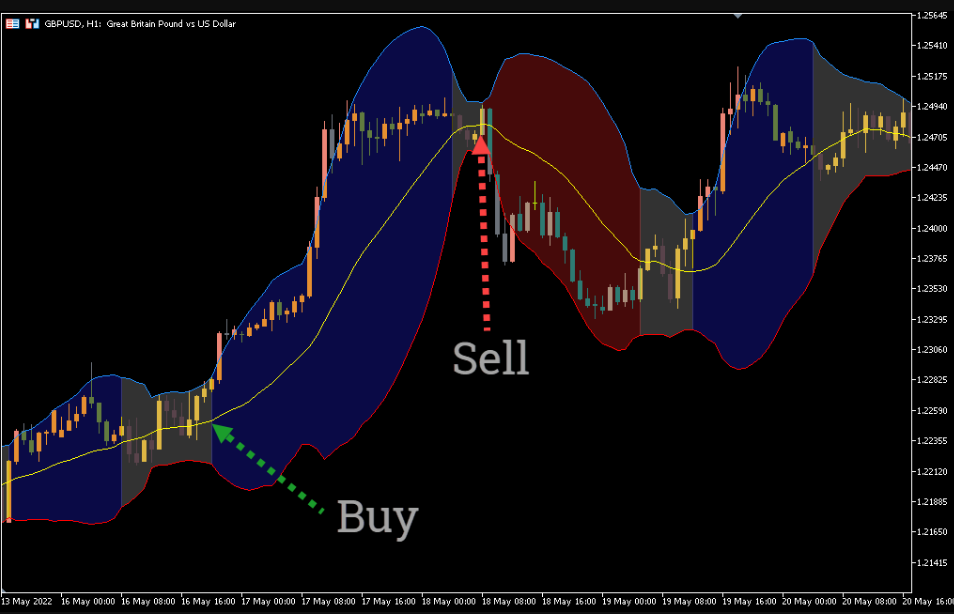
It gives a BUY signal when the upper and lower bands turn BLUE and a SELL signal when they turn RED.
The best way to trade profitably with this indicator is shown above. The above chart shows the activity of the indicator on the EUR/USD pair on the H4 timeframe.
To get a highly probable bullish setup (BUY), first, wait for a candle (preferably a bullish candle) to open and close above the light blue moving average. Enter a LONG position if the bars turn BLUE.
The same principle applies to bearish setups (SELL). Wait for a candle (preferably bearish) to open and close below the light blue moving average. Also, make sure the bars turn RED before opening a SELL position.
Conclusion
Bollinger Bands Color Indicator for MT5 can help you with high entry accuracy. It does all the technical analysis in the background and draws the entry signal on the chart.
Although this indicator can be used in isolation, it is recommended to use it in conjunction with price action or other uncorrelated indicators for best results. It’s free to download, so give it a try.
You must be logged in to post a review.

Copyright 2025

Reviews
There are no reviews yet.