Best Pullback Factor Indicator
The Pullback Factor Indicator for MT4 shows traders the end of a trend retracement and, thus, the continuation of the trend.
The most profitable trading in the forex market is trend trading. Every forex trader always wants to trade along with the trend of the market. However, entering a trend late might be too dangerous and can result in a trade stop-out.
Therefore, many traders love waiting for a trend retracement or pullback before placing trades. As simple as this may sound, it is never easy to predict the extent of a trend pullback. Even with the use of Fibonacci retracement, determining the exact retracement point can be difficult. However, with the use of Best Pullback Factor Indicator, forex traders can know when the trend resumes.
The foundation
The Best Pullback Factor Indicator for MT4 shows traders the end of a trend retracement and, thus, the continuation of the trend. With this indicator, traders can take advantage of a trend pullback to enter the market with the best entry point. This indicator also allows traders to enter fewer risky trades with perfect timing and accuracy.
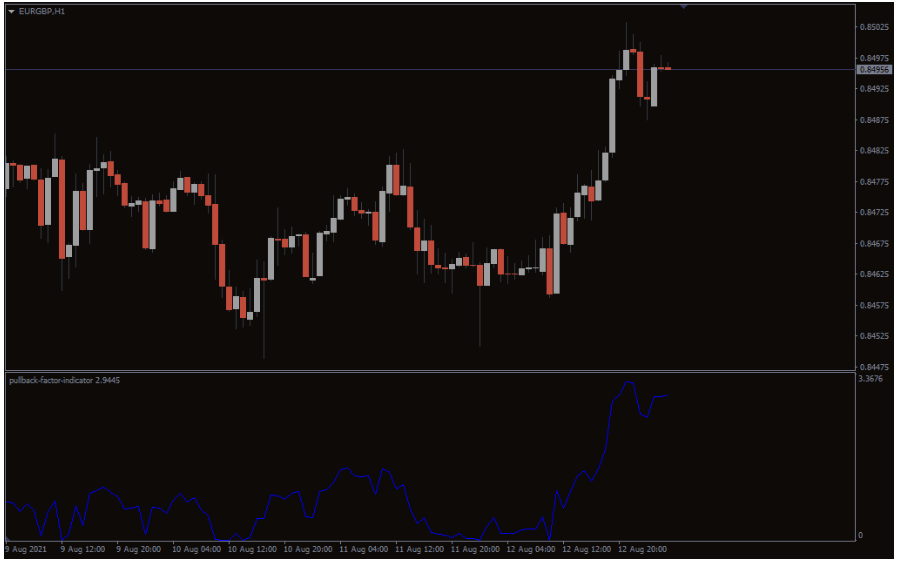
The diagram below shows what the Pullback Factor Indicator looks like on the chart.
From the GBP/USD H1 chart above, the Pullback Factor Indicator reading is 1.5738. These indicator readings are from 0 to 3.6, and any readings above 1.5 means the chances that a retracement has ended is high.
This indicator is best for swing traders and position traders who make use of hourly, daily, weekly and monthly time frames. The Pullback Factor Indicator, however, is not advisable for scalpers as they will get fake-out trades most times.
Traders must be familiar with price action and market structure before using this indicator. In fact, this indicator is not suitable for forex newbies who have little knowledge of trading. For best practices, a combination of this indicator with Fibonacci tools will give good trade setups.
How to use the Pullback Factor Indicator
Traders should watch for the value of the Pullback Factor Indicator. When the indicator is above 1.5, it means the trend pullback is coming to an end. Thus, traders should look out for the trend continuation and a good entry point.
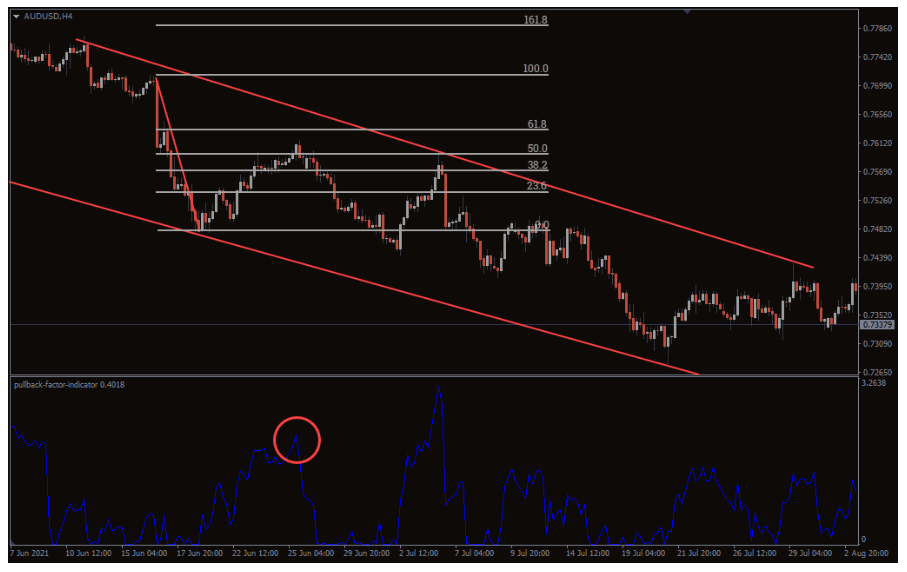
The diagram below is an illustration on how this indicator can be used.
The AUD/USD H4 chart above clearly shows that the market is in a downtrend as shown by the trend lines. When the price touches the lower trendline of the channel on June 21, 2021, price pullback.
Incorporating Fibonacci tools to this indicator, it is seen that the price has retraced to the 61.8% Fibonacci level. On June 25, 2021, the Pullback Factor Indicator value rose to 1.9 (blue highlight). This is a signal that the downtrend pullback is coming to an end. A bearish engulfing candle formed on the chart afterwards is a confirmation that the downtrend has resumed.
A sell position can be placed immediately after the formation of the bearish engulfing candle. The stop-loss should be placed just above the 61.8% Fibonacci level. Furthermore, the take-profit level should be placed at the touch of the next lower trendline of the channel. This trade will give a perfect entry, low-risk, high-reward trade.
Conclusion
The Pullback Factor indicator is a useful tool that knows when a trend retracement has ended. It is a perfect tool to spot a perfect entry trade with great risk to reward ratio. This indicator will give the best result when coupled with Fibonacci tools.
Newbies are advised not to use this indicator blindly. Finally, this indicator is best used for hourly, daily, weekly and monthly time frames.
You must be logged in to post a review.

Copyright 2025

Reviews
There are no reviews yet.