Hull Moving Average Indicator
The Hull Moving Average represents a technical indicator developed for MT4 platforms. Generates best trend-following buy–sell signals for forex day traders. Supports MTF charts
CATEGORIES: TREND, MT4, SIGNAL, LEVELS
Updated on: 17.11.2023
The Hull Moving Average (HMA) is a short-term trend signal indicator built for the MetaTrader 4 platform. This indicator is best known for emphasizing more on recent price data and producing fast trend-reversal signals.
Generally, traders who seek trend signals based on recent changes in price-action prefer to use Exponential Moving Averages (EMA). Because Simple Moving Averages (SMA) lag more than EMAs when applied for short-term trend analysis. In this regard, Hull Moving Average offers both fast and smooth trend trading signals for forex day traders.
How to use Hull Moving Average for determining forex day trading signals
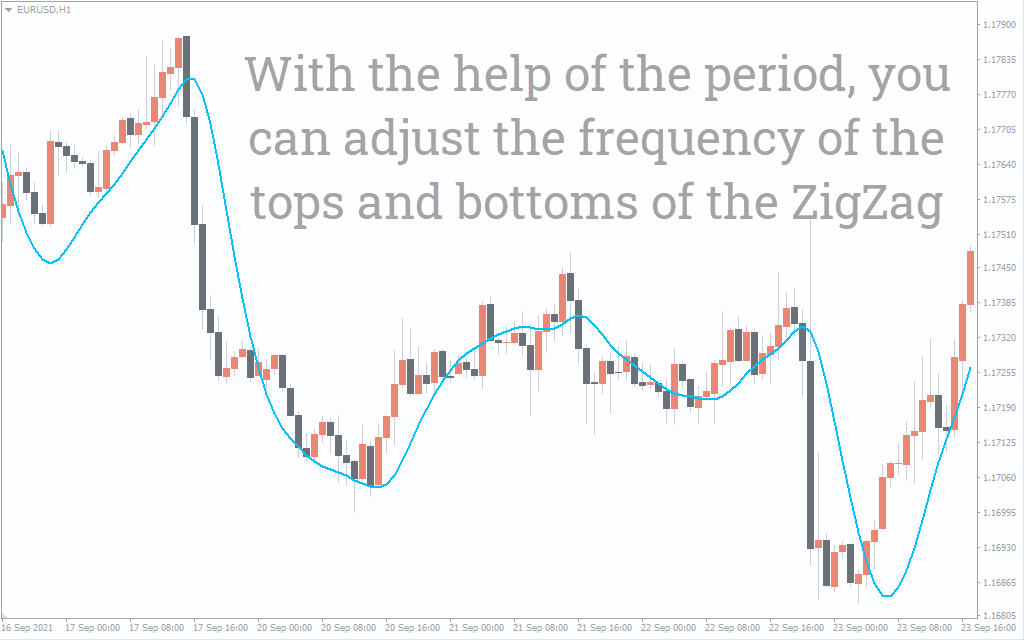
The HMA works in the same manner as applying other moving averages for anticipating the current trend conditions. Since this indicator is specially developed for short-term trend detections, it may react faster with recent price changes and generate frequent signals. So, for better results, you may combine its trend signals with candlestick patterns to increase the success probability.
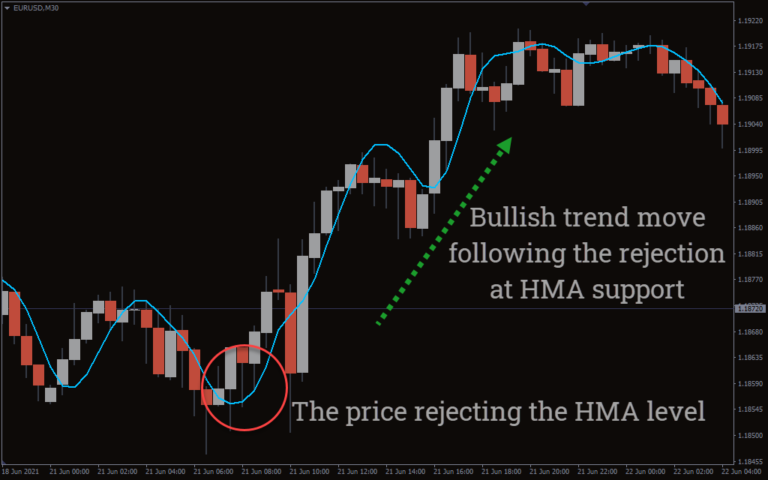
According to the above EURUSD chart, the market was initially choppy and the price was neither moving in a bullish or bearish direction. During this period, the price broke the HMA level several times. However, none of those signals were profitable due to an extremely short-range movement of the price.
At a point, the price crossed above the Hull Moving Average line and plotted three bullish candles in a row. Each of those candles was rejecting the indicator level and treating it as a support. So, the price trend turned bullish since it moved above the indicator line. At the same time, those bullish-tailed bars were indicating a further extension of the current bullish price movement. As we can see, the price made a strong uptrend move following the rejection at the HMA support line.
For a sell confirmation, the price needs to be closed below the indicator curve confirming a bearish market trend. Next, look for a bearish candlestick pattern to make sure the price is respecting the moving average line as resistance.
Conclusion
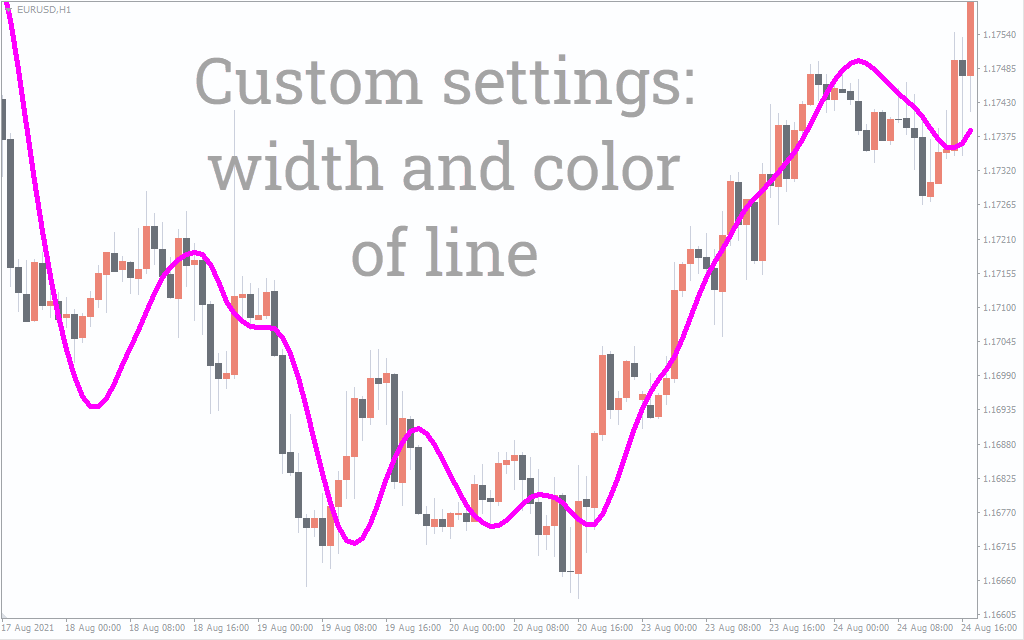
The best part of HMA indicator is, it’s way more faster than other standard moving averages in reacting with the price-action changes. This particular quality of this indicator has ended the long-term lagging issues involved with regular moving averages. On top of that, this indicator moves quite close to the price of candles but still improves its smoothing results. However, the Hull Moving Average indicator only focuses on recent changes in the market and only tells you about the current trend condition. It doesn’t deliver future trend signals like an SMA or EMA crossover does.
You must be logged in to post a review.

Copyright 2025

Reviews
There are no reviews yet.