125d
Day Trading 8.0
Effortless trading: non-repainting indicator for accurate price reversals
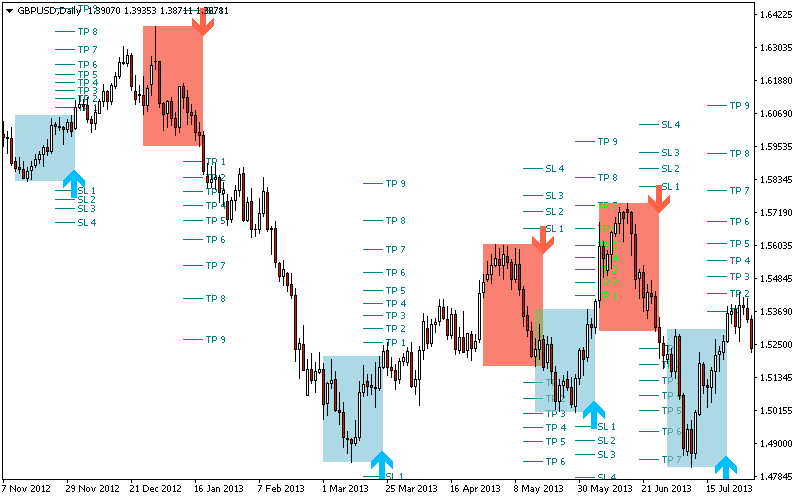
This indicator detects price reversals in a zig-zag fashion, using only price action analysis and a donchian channel. It has been specially designed for short-term trading, without repainting or backpainting at all. It is a fantastic tool for shrewd traders aiming to increase the timing of their operations.
Amazingly easy to trade
It provides value on every timeframe
Chart statistics will help you to optimize your trading
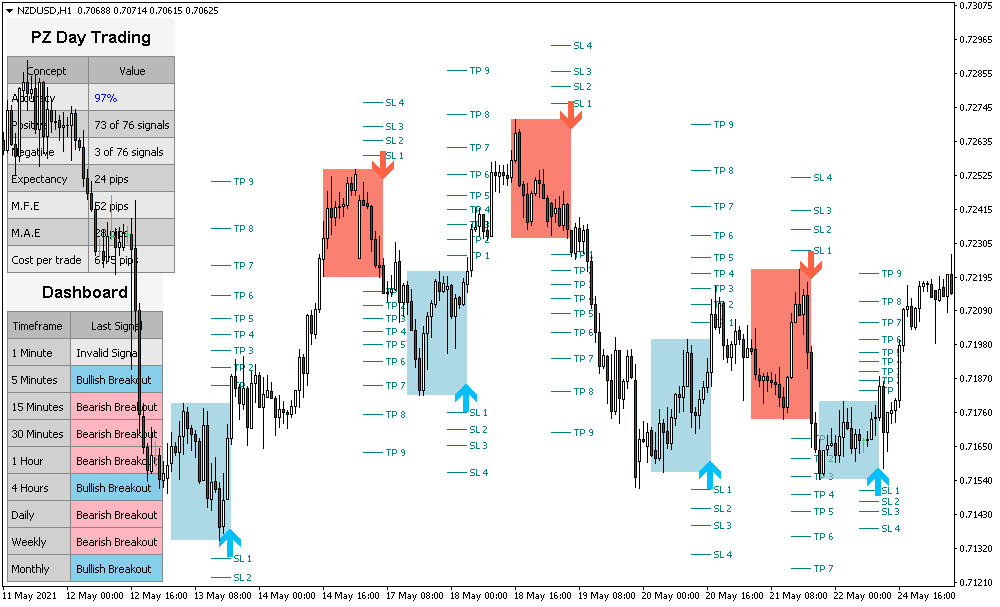
It implements a multi-timeframe dashboard
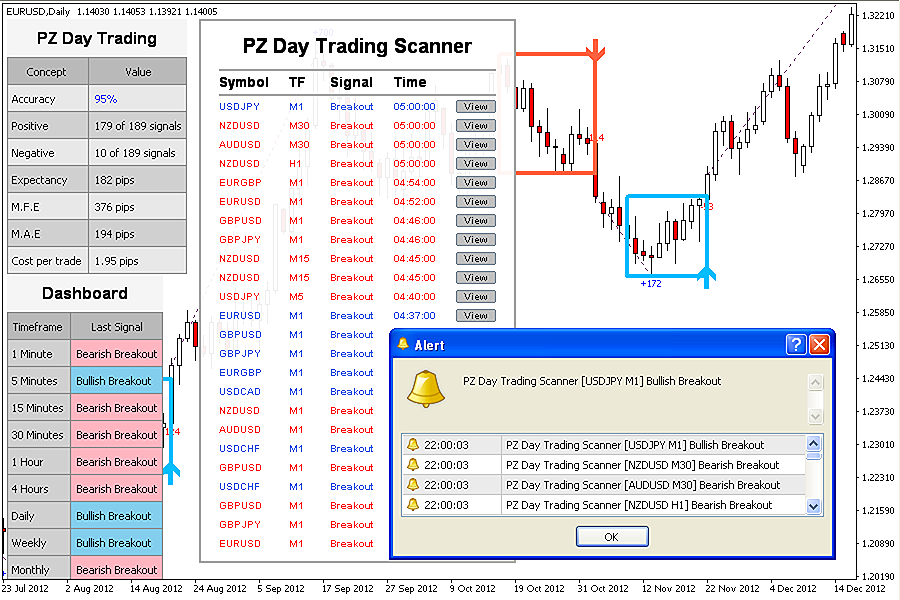
It includes a multi-symbol and multi-timeframe scanner
It implements email/sound/visual alerts
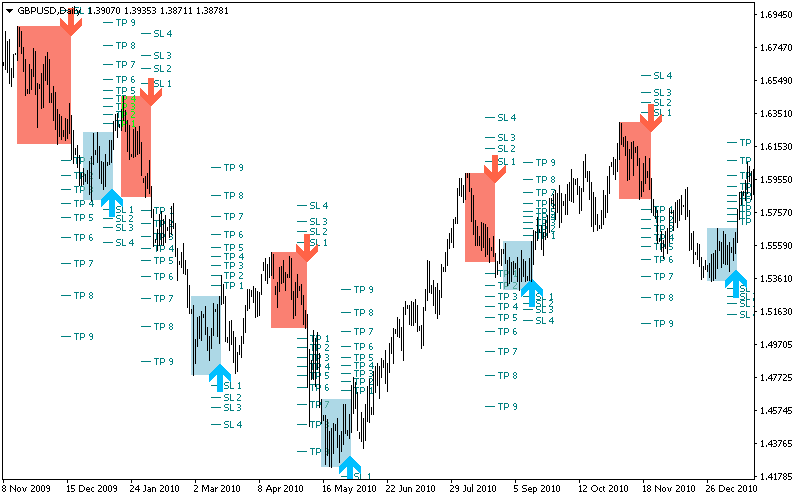
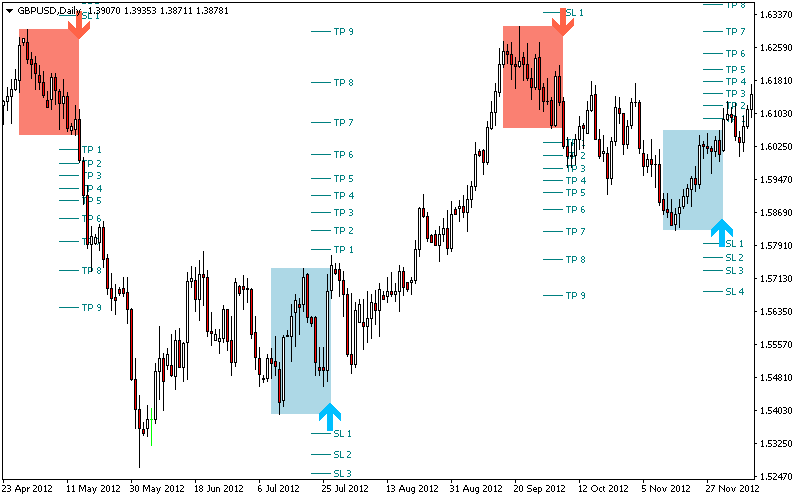
Based on breakouts and congestion zones of variable lengths, the indicator uses only price action to pick trades and reacts to what the market is doing very fast.
The potential profit of past signals is displayed
The indicator analyzes its own quality and performance
Losing breakouts are highlighted and accounted for
The indicator is non-backpainting and non-repainting
Trading Guidelines
Suitable instruments: Forex, Commodities, Indices, Stocks and Crypto
Suitable timeframes: Daily, 12 Hours, 8 Hours, 4 Hours, 2 Hours, 1 Hour and 30 Minutes
This indicator will help intraday traders not to miss a single price reversal. However, not all price reversals are created equal nor have the same actionable quality. Deciding which breakouts to trade and which to ignore depends on the good judgement of the trader .
Buy today and unlock exclusive bonuses!
Purchase this tool now and receive the following bonuses (total value: $90).
Tick Chart Indicator (worth $30.00) [Check it out]
Market Depth Indicator (worth $30.00) [Check it out]
Multi TDI Indicator (worth $30.00) [Check it out]
How to interpret the stats
The indicator studies the quality of its own signals and plots the relative information on the chart. Every trade is analyzed and the overall historic results displayed at the top-left corner of the chart.
Maximum Favorable Excursion (MFE)
The MFE is the best possible outcome for any given trade.
The average MFE is displayed at the top-left corner of the chart.
Maximum Adverse Excursion (MAE)
The MAE is the worst possible outcome for any given trade.
The average MAE is displayed at the top-left corner of the chart.
Average Absolute Expectancy (AAE)
The AAE is the absolute excursion you can expect for any given trade, obtained by subtracting the MAE from the MFE, which reflects the true quality of the entry strategy. In other words, the entry strategy is measured by the relationship between the average best possible outcome and the average worst possible outcome.
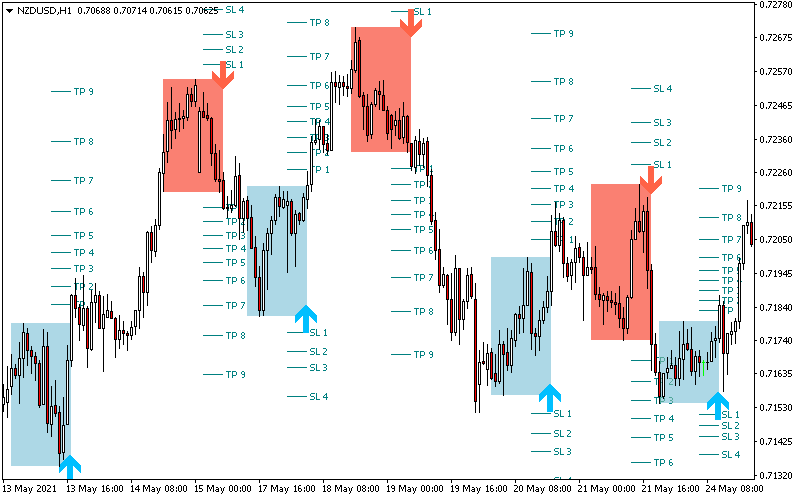
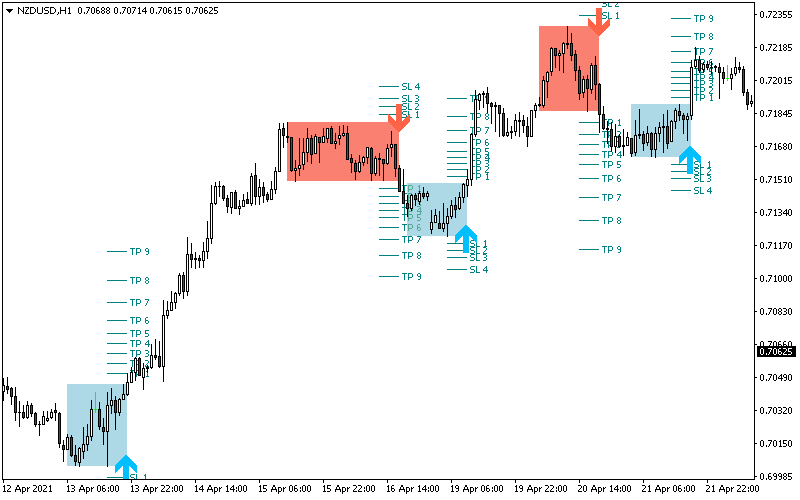
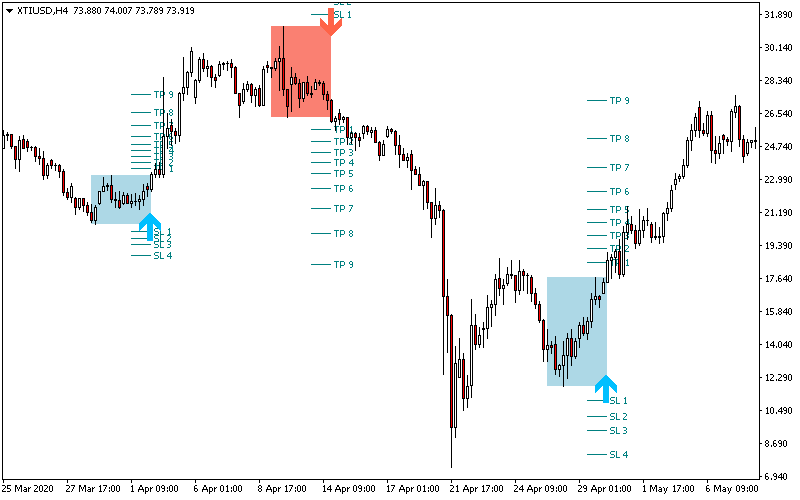
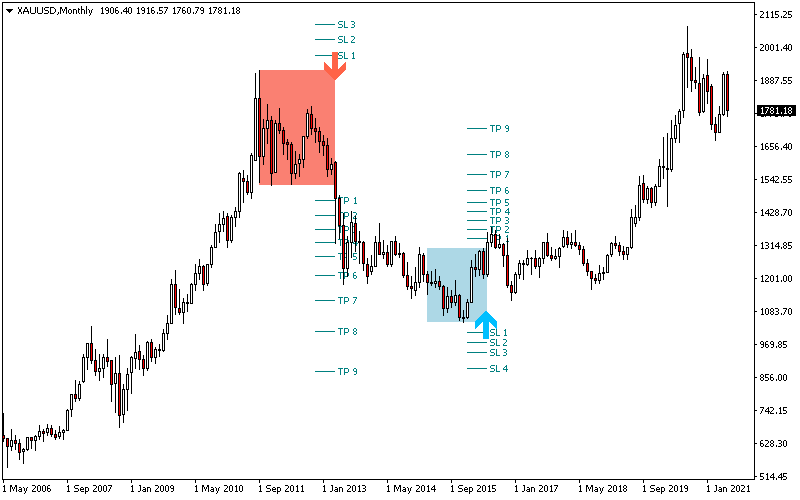
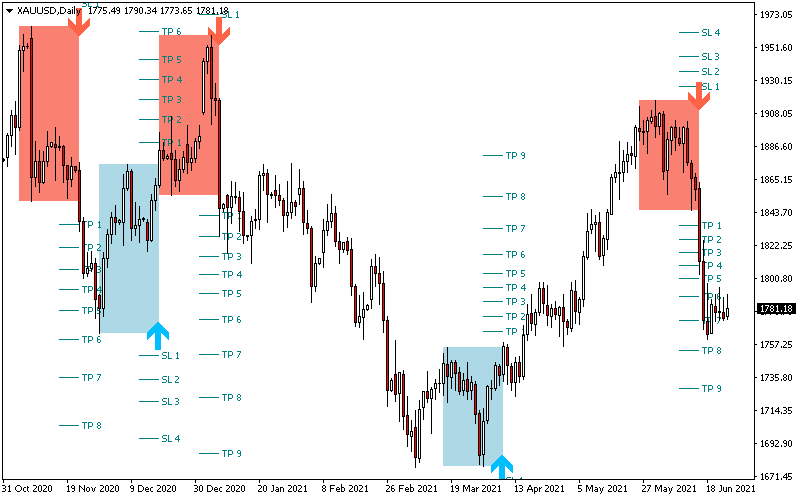
The indicator displays the best possible outcome and the worst possible outcome for every trade using two dotted lines and two price labels, and account every single one of them into the statistics you can find at the top-left corner of the chart. You can use those statistics to optimize the indicator parameters by yourself, for any given instrument and timeframe.
When loading the expert to any chart, you will be presented with a set of options as input parameters. Don’t despair if you think they are too many, because parameters are grouped into self-explanatory blocks.
Range
The range is the minimum amount of bars broken to consider a breakout valid and draw a signal. As you go down in timeframes, you need to increase this parameter. For example, to trade monthly charts a range of five is good, but to trade H1 charts you would need a range of at least 20-25 bars.
Filter
The function of the filter is to separate alternative signals from each other, using a donchian channel and a multiplier of the price range it creates. A higher filter will decrease the amount of signals in the chart but, in average, increase the maximum favorable excursion.
Max History Bars
The amount of past bars to evaluate when the indicator loads. Decrease this value to speed up loading of the indicator.
Dashboard:
Enable or disable the multi-timeframe dashboard widget.
Statistics
Enable or disable the statistics widget. Use the stats to find the best parameters for each symbol and timeframe. Incrementally change the input parameters of the indicator until you find the higher accuracy and expectancy possible.
Display boxes
Display or hide the colored boxes around the breakout price range.
Fill boxes
Choose wether the inside of the breakout box is filled with color.
Trade Analysis
Enable or disable the individual trade analysis in the chart.
Alerts
Enable display/email/push/sound alerts for breakouts.
You must be logged in to post a review.

Copyright 2025


Reviews
There are no reviews yet.