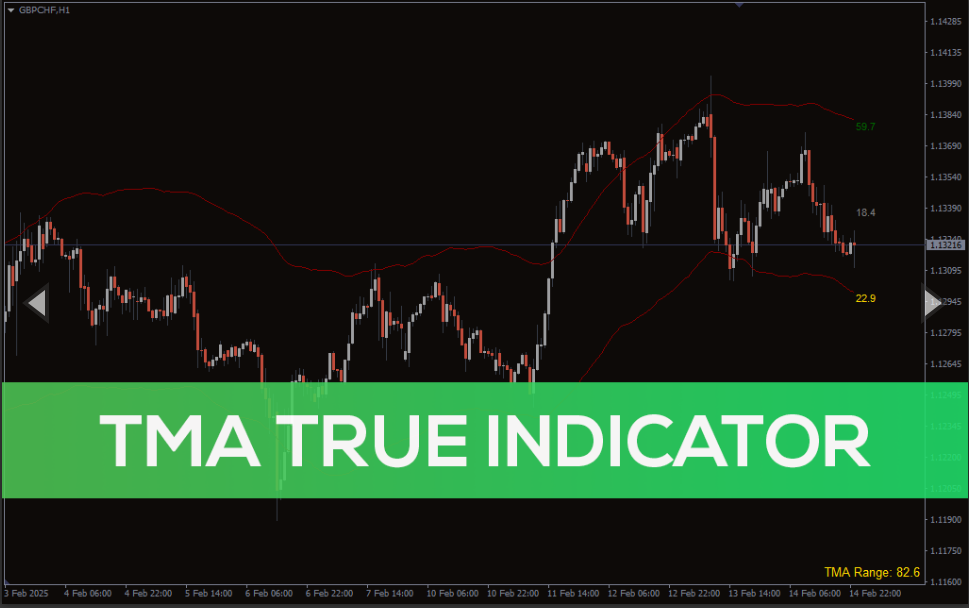
The TMA True Indicator for MT4 is a non-repainting trend tool based on the Triangular Moving Average (TMA). It provides dynamic support and resistance levels, helping traders identify overbought and oversold conditions for precise trade entries and exits.
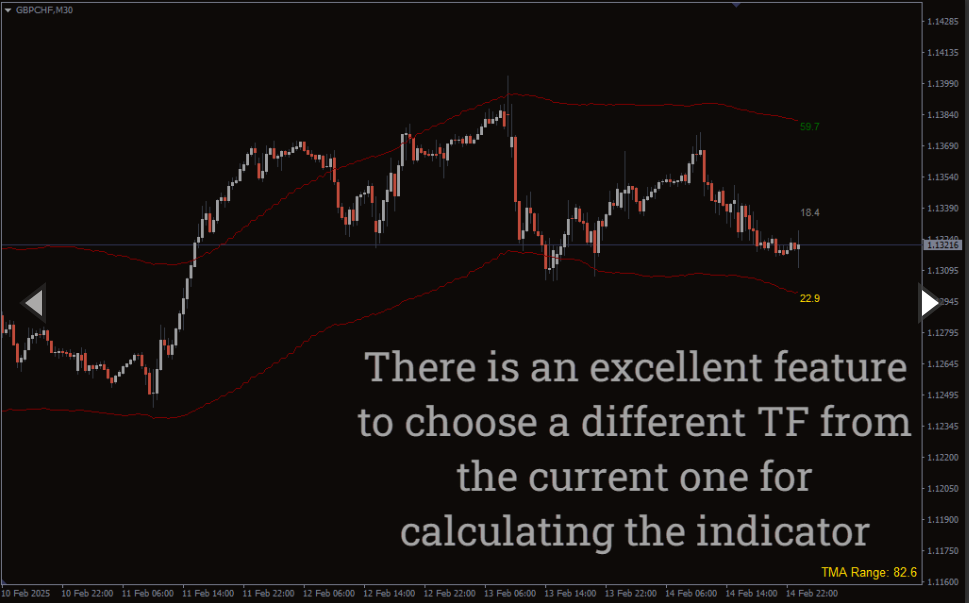
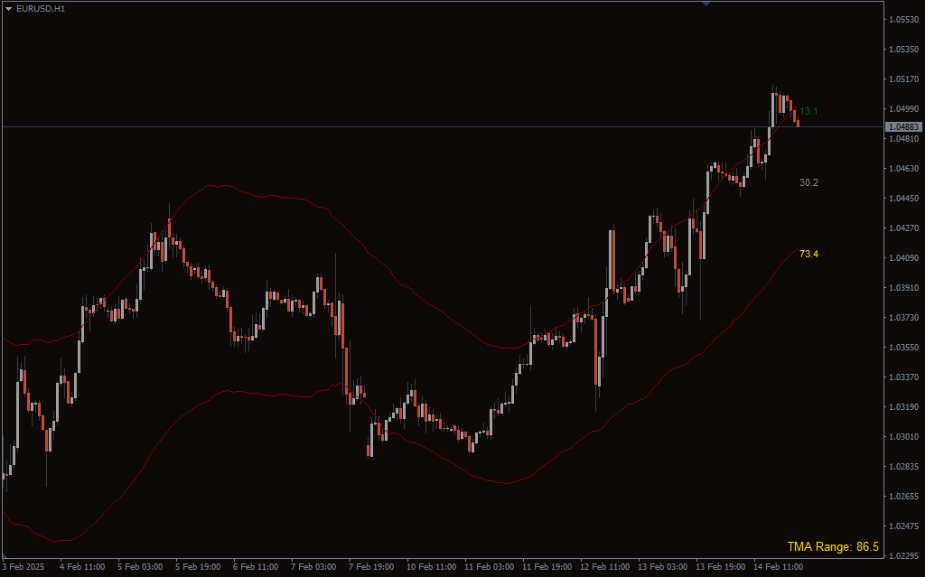
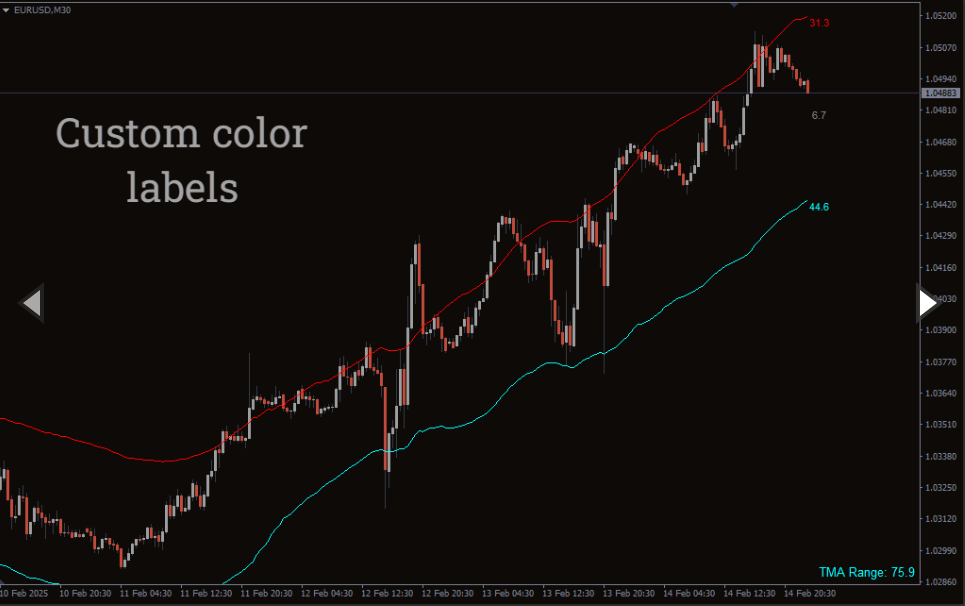
The TMA True Indicator is a powerful tool designed to help traders analyze trends and market volatility with greater precision. Unlike traditional TMA indicators, this version eliminates repainting, ensuring that signals remain stable after appearing on the chart. The indicator plots dynamic upper and lower bands that expand and contract based on volatility, allowing traders to recognize potential breakouts, reversals, and trend continuations. Whether you’re a short-term scalper or a long-term trend trader, the TMA True Indicator provides reliable insights to improve your decision-making process.
TMA True Indicator Trading Signals
When the price reaches the upper TMA band, the market is considered overbought, signaling a possible downtrend or retracement. If the price approaches the lower TMA band, it indicates an oversold condition, suggesting a potential upward reversal. The middle TMA line acts as a dynamic trend filter: if the price remains above it, the market is in a bullish trend; if it stays below, the trend is bearish. Traders can use these signals to confirm trade setups and improve their entry and exit points.
Conclusion
The TMA True Indicator is an essential tool for traders looking to enhance their trend analysis and market timing. By providing adaptive support and resistance levels, it helps traders identify ideal trade entries and exits based on market volatility. The non-repainting nature of this indicator ensures that trading signals remain accurate, making it a valuable asset for scalpers, swing traders, and long-term investors alike.
Reviews
There are no reviews yet.
Be the first to review “TMA True Indicator” Cancel reply
We use cookies to ensure that we give you the best experience on our website. If you continue to use this site we will assume that you are happy with it.Accept


Reviews
There are no reviews yet.