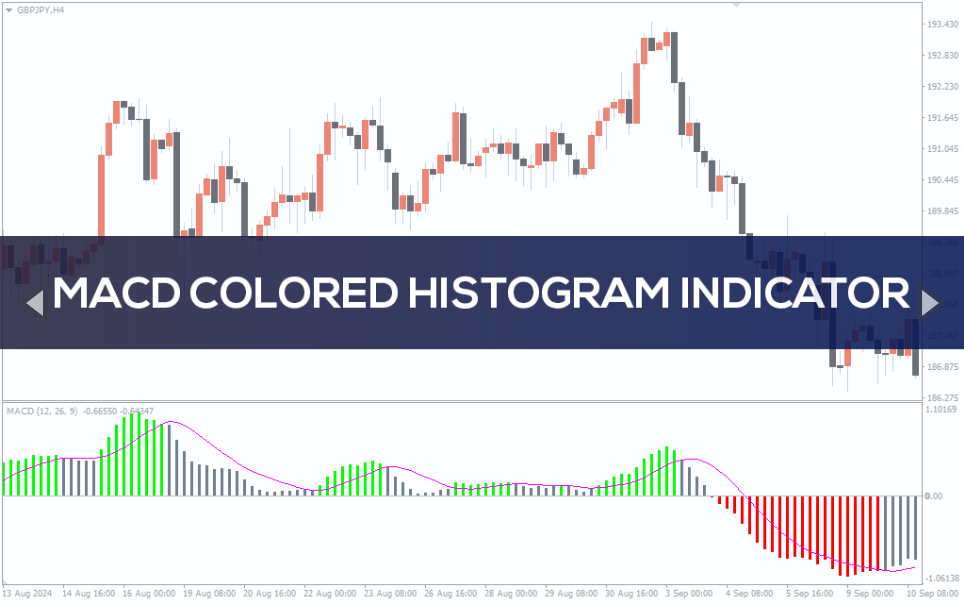
MACD Colored Histogram Indicator
MACD Colored Histogram Indicator For MT4 enhances the traditional MACD by color-coding histogram bars, helping traders spot bullish and bearish trends with greater clarity.
The MACD Colored Histogram Indicator for MT4 is a powerful enhancement of the classic MACD (Moving Average Convergence Divergence) tool, providing traders with clearer visual cues for identifying trend strength and momentum shifts. The traditional MACD is already widely used for determining market direction and potential reversals, but this version takes it a step further by adding color-coded bars to the histogram. These colors help traders easily distinguish between bullish and bearish trends.
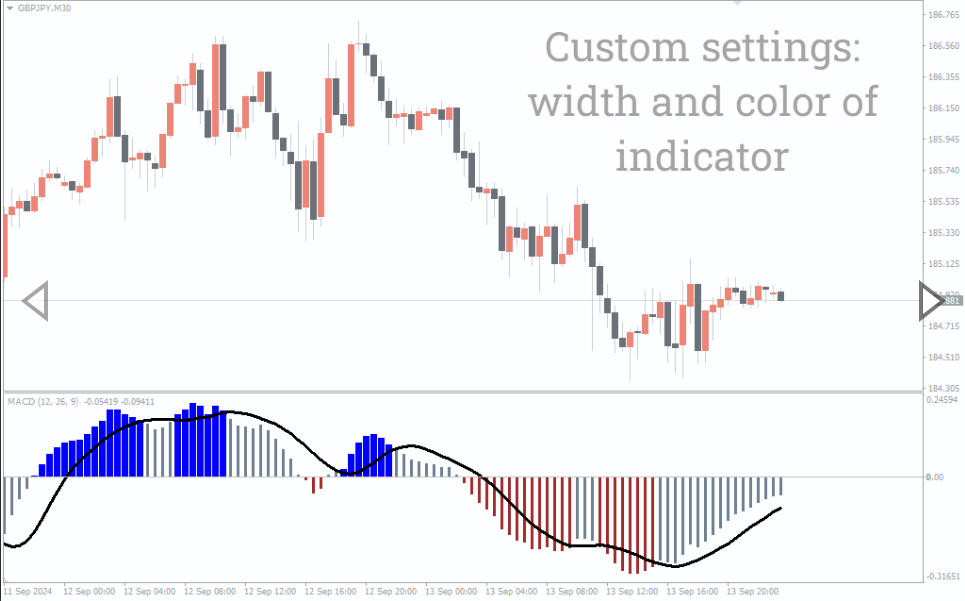
This indicator is suitable for all types of traders, from beginners to advanced users, and can be applied to a variety of time frames and trading strategies.
MACD Colored Histogram Indicator For MT4 Trading Signals
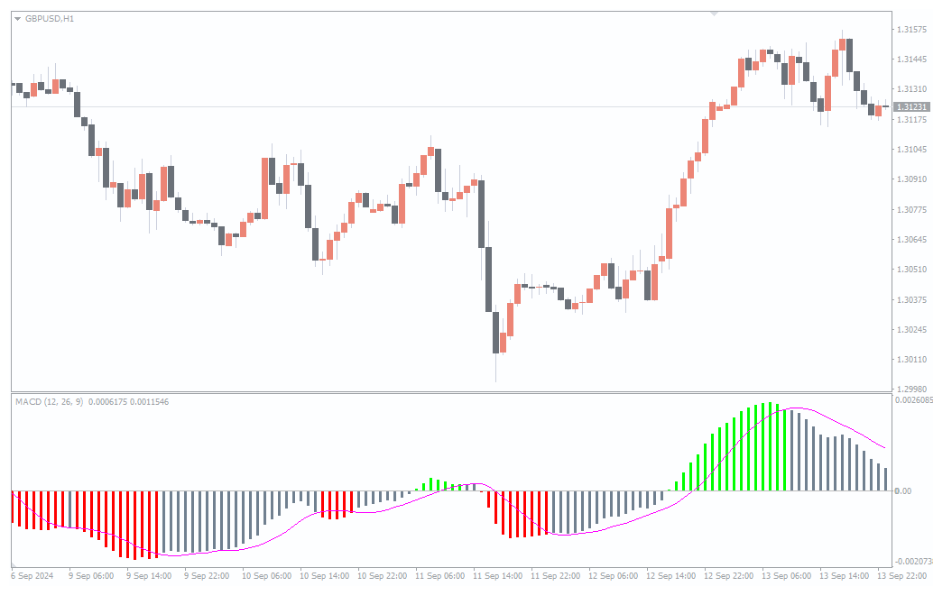
The MACD Colored Histogram Indicator works by plotting a histogram that oscillates around the zero line, along with a signal line and two moving averages (fast and slow EMAs). The histogram bars are color-coded to represent bullish or bearish market conditions:
Green bars indicate increasing bullish momentum, suggesting a buy signal.
Red bars indicate increasing bearish momentum, signaling a potential sell.
Gray bars indicate weakening momentum, signaling a possible trend shift or consolidation.
Traders can use these color cues to time their entries and exits. For example, when the bars turn green and are above the zero line, it indicates strong bullish momentum, which may be a good time to enter a long position. Conversely, red bars below the zero line suggest increasing bearish momentum and could signal a good time to sell or open a short position.
Conclusion
In summary, the MACD Colored Histogram Indicator for MT4 is a highly effective tool for traders looking to enhance their market analysis by using color-coded histogram bars to easily identify bullish and bearish trends. The added visual clarity makes it easier to spot momentum shifts and make informed trading decisions. This indicator is a valuable addition to any trader’s toolkit, offering flexibility and precision for a variety of trading styles.
You must be logged in to post a review.

Copyright 2025


Reviews
There are no reviews yet.