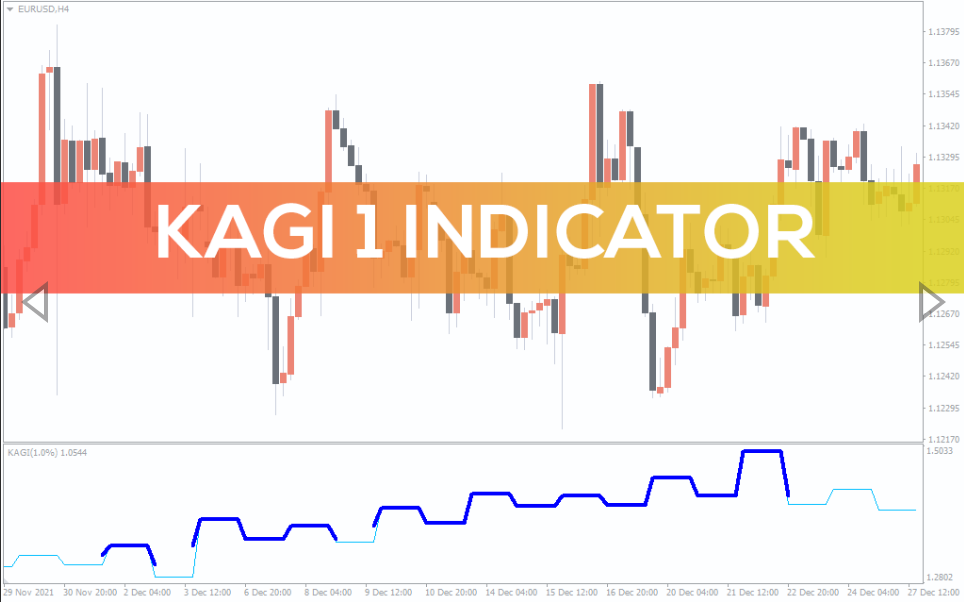
KAGI 1 Indicator
Introducing you to simply the best trend-following MT4 oscillator that precisely reveals market trends on MTF charts. Ideal for forex & stock trading strategies.
The KAGI 1 for MT4 is an intriguing technical indicator that can aid traders in more precisely identifying buy-sell entries and exits, especially in forex and stock markets.Buying or selling assets based on the recent strength of market trends is known as momentum trading. It is predicated on the notion that if a price move has sufficient momentum, it will keep moving in that way.
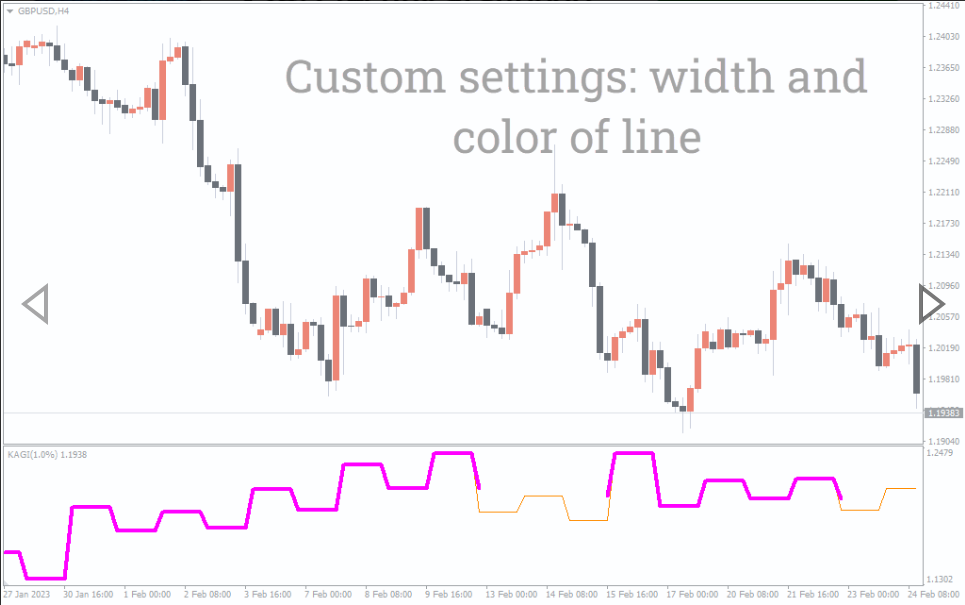
The KAGI 1 weighs more on recent price actions enabling it to react immediately to potential changes in market trends. Its signal line uses light and thick blue colors to show whether it’s a bullish or bearish sentiment taking control of the current momentum. Additionally, the KAGI 1 is an MTF indicator and enables you to simultaneously look for short and long-term trading opportunities, including scalping, day, and intraday trading. This guide explains how to trade within the correct market trend using the KAGI 1 MT4 indicator.
How to Anticipate Buy-Sell Signals Using the KAGI 1 Indicator in MT4
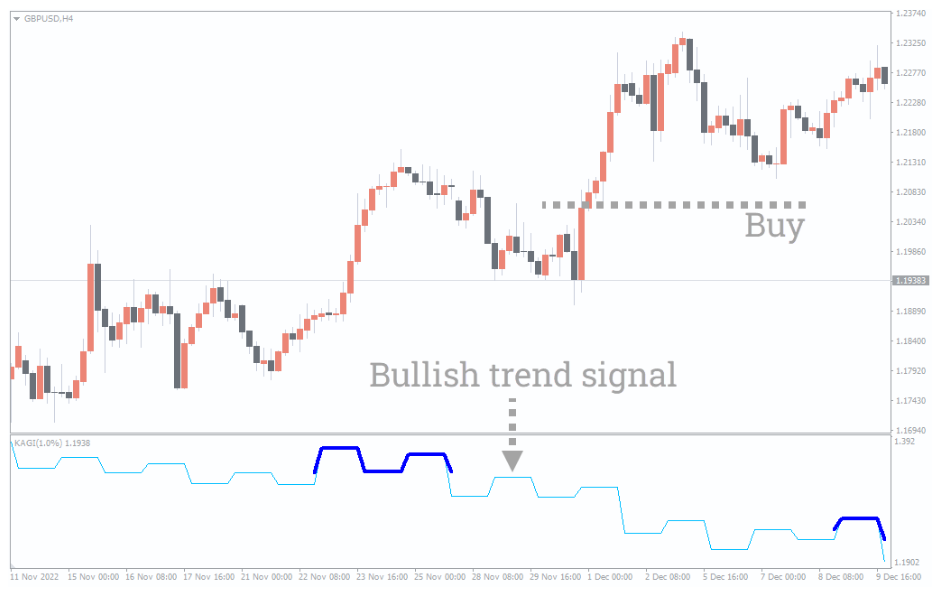
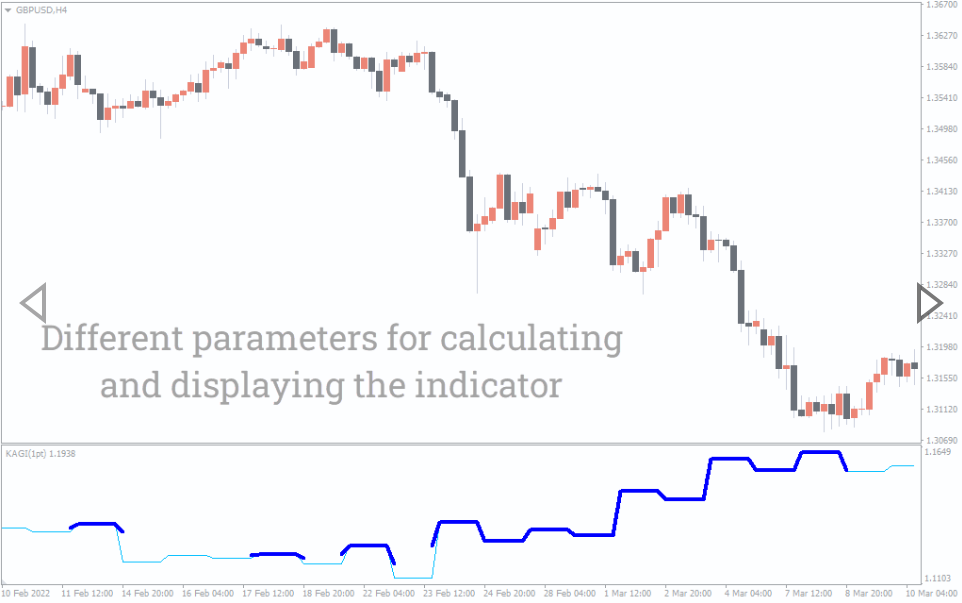
If you can track the moment when the KAGI 1 level changes its color, you’ll be able to predict the upcoming changes in market bias. The thick blue line indicates a bullish trend, and the light blue line signals a bearish trend.
Interestingly, the indicator slope moves in an opposite direction to demonstrate the trend’s strength and weakness. It means the value of the indicator decreases during a bullish market. Conversely, the value keeps rising when the price continues to move in a bearish direction.
The above GBP/USD H4 chart represents a buy signal example we identified using the KAGI 1 indicator. The price was initially trending up as it moved above the bullish trendline. During the surging upside, the price rebounded for a correction to retest the support line. Later, the price rejected the trendline support and initiated another bullish move. Meantime, the KAGI 1 indicator slope turned thick blue, confirming a buy signal following the overall bullish trend.
Before you go short, the indicator must plot a light blue line to ensure the market is under a strong downtrend. Next, look for a bearish candlestick pattern to confirm a sell order.
Conclusion
The KAGI Indicator represents one of the simplest technical tools to identify potential entry and exit points on MT4 charts. The indicator works by plotting two lines on the chart, one for support and one for resistance. Closely monitoring the change in color of the indicator slope can help you spot a potential trade signal that has been generated. The KAGI 1 indicator also helps traders identify trend reversals, which can be used as an additional signal for entering and exiting trades. This indicator is simple to use and can be an effective tool for traders looking to maximize their profits in the forex and stock markets.
You must be logged in to post a review.

Copyright 2025
Reviews
There are no reviews yet.