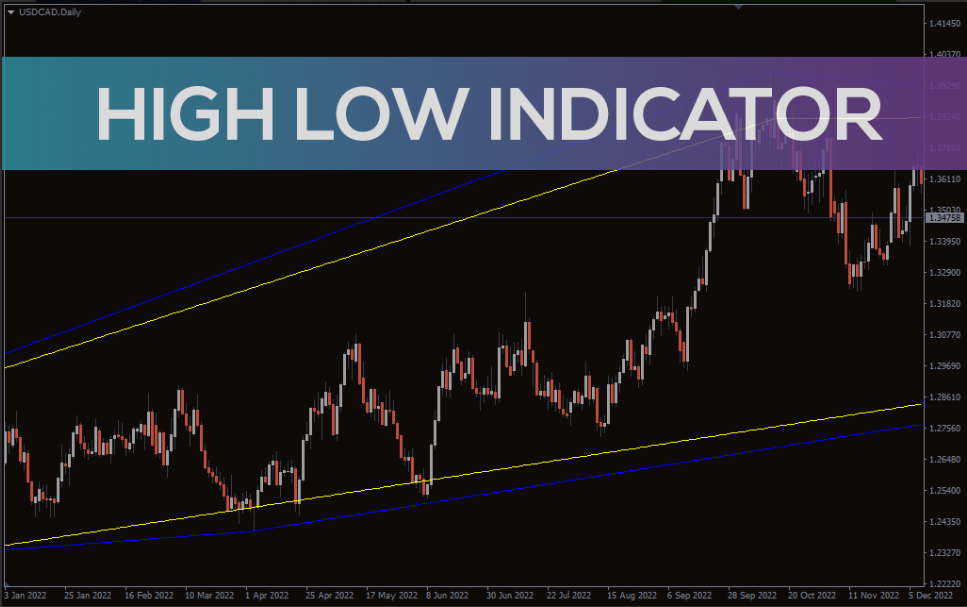
Enhance your winning probability with the High Low Indicator for MT4, providing great insight on the chart to trade reversals or breakouts.
The High Low indicator for MT4 has two bands, black and blue. Both the bands encapsulate the lows and highs of the price. The bands can be used to trade the continuation or breakout.
How To Use The High Low Indicator For MT4
There are two main uses of the indicator:
Find a breakout trading opportunity
Find a continuation trading opportunity
First of all, the bands indicate the directional bias of the market. The market is in the bearish phase if the bands point to the downside and vice versa. Once you know the bias, you are half done. Then, you can look for the appropriate trade entries.
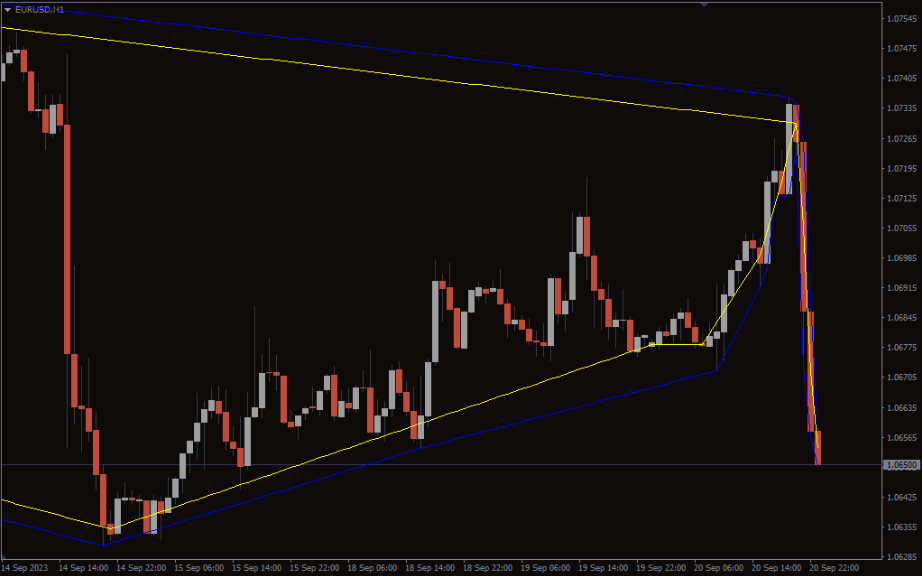
If the bands are wide, you can look for a continuation setup. You can take a short entry whenever the price touches the upper bands. Similarly, when the price touches the lower bands in an uptrend, you can enter the long trades.
When the bands are narrow, it is likely for the market to face a breakout/reversal. In this case, wait for the breakout candle to close and the direction of bands to shift.
Conclusion
High Low is a straightforward indicator that works the same as Bollinger Bands. To find efficacy, you should test the indicator on broader timeframes and different assets. Always test on the demo before running on your live account.
Reviews
There are no reviews yet.
Be the first to review “High Low Indicatorv” Cancel reply
We use cookies to ensure that we give you the best experience on our website. If you continue to use this site we will assume that you are happy with it.Accept

Reviews
There are no reviews yet.