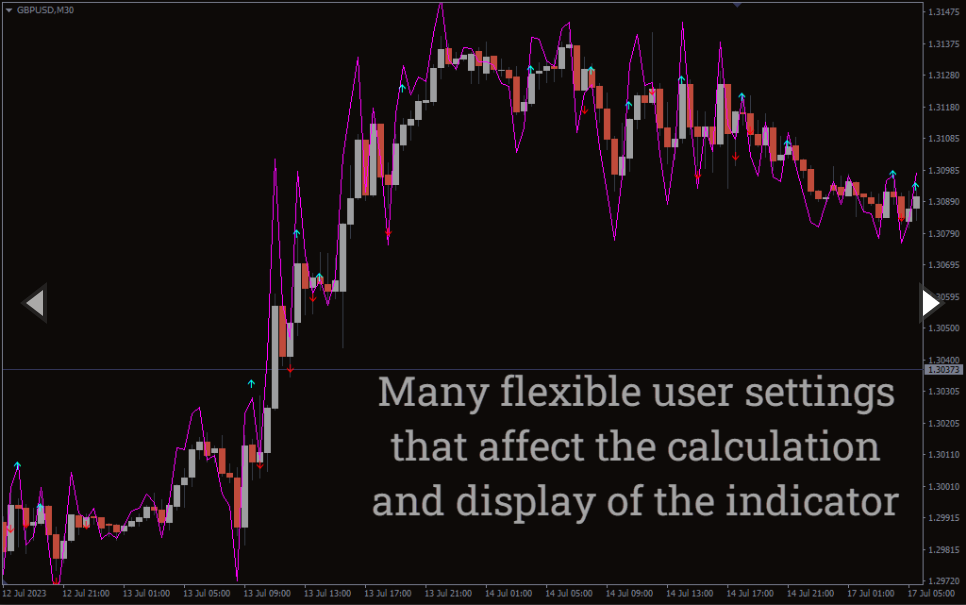
The Chart Speed Indicator uses MA and arrows to tell the direction of the trend and give BUY/SELL signals.
The Chart Speed Indicator uses a moving Average with red and aqua arrows to signify the trend’s direction.
The moving average helps to filter out short-term fluctuations in price, providing a clearer view of the underlying trend.
On the other hand, the arrows act as potential entry or exit points. The red arrow suggest a bearish entry point, while the aqua arrow mentions the bullish entry point.
How to use the Chart Speed Indicator for MT4?
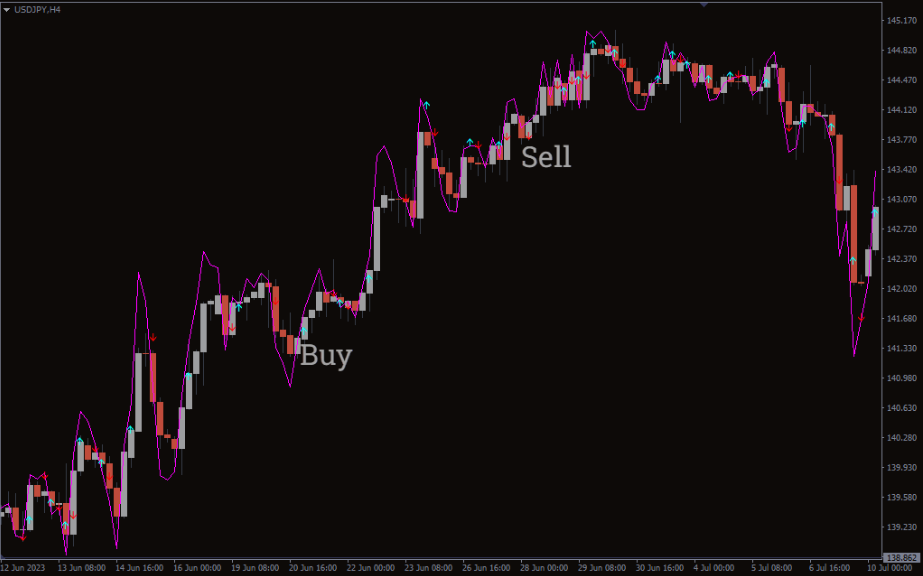
The above USD/JPY H4 chart shows indicator’s BUY/SELL signals.
When the price moves below the MA and an aqua arrow appears, it suggests a buy signal. Conversely, when the price goes above the MA and a red arrow appears, it indicates a sell signal.
The purpose of combining the MA with arrows is to enhance the clarity of the trading signals. The MA provides a general indication of the trend’s direction, and the arrows highlights specific points at which you can enter or exit the trade.
It’s important to note that the indicator can draw arrows randomly on the chart. So, you need to combine the Chart Speed Indicator with other indicators or tools to limit false signals.
Conclusion
The Chart Speed Indicator for MT4 combines the MA with colored arrows to provide trading signals. The MA helps to identify the overall trend direction, while the arrows pinpoints entry and exit points.
Reviews
There are no reviews yet.
Be the first to review “Chart Speed Indicator” Cancel reply
We use cookies to ensure that we give you the best experience on our website. If you continue to use this site we will assume that you are happy with it.Accept


Reviews
There are no reviews yet.