B Regression Analysis V2 Indicator
B Regression Analysis V2 Indicator For MT4 calculates four types of regression methods plots the best one and helps forex traders with a best entry point
The B Regression analysis V2 indicator for MT4 calculates the linear, quadratic, logarithmic and exponential regression values. Furthermore, it automatically identifies the best regression method that fits the current forex price chart and displays it. As a result, forex traders can have the best possible entry points based on regression.
The indicator is similar to support and resistance or channel trading and is suitable for new and advanced forex traders. Moreover, it works on all intraday price charts as well as the higher charts.
B Regression Analysis V2 Indicator For MT4 Trading Signals
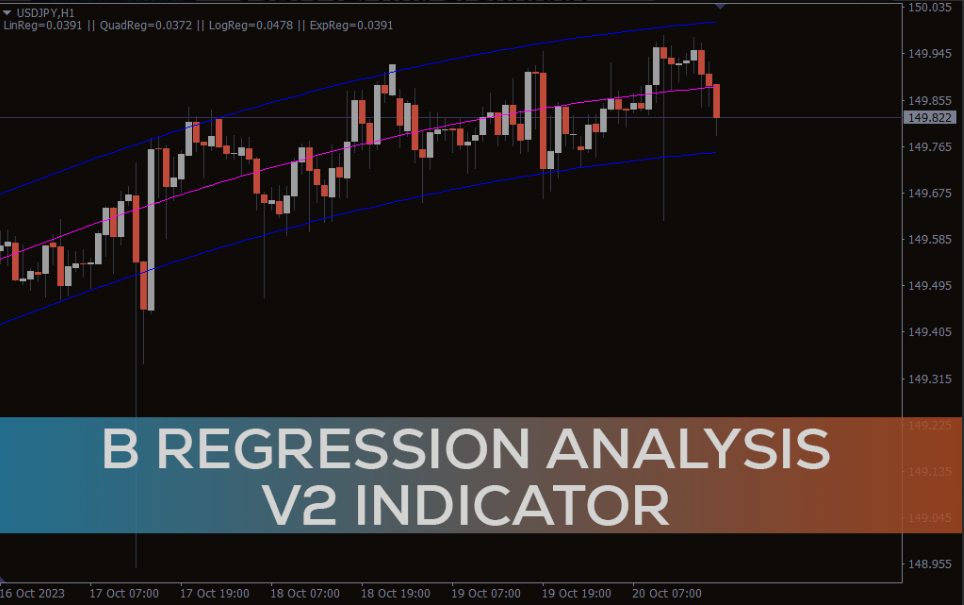
The indicator plots the upper and lower regression bands in blue and the mid line as magenta. Furthermore, it plots the values of the linear, quadratic, logarithmic and exponential regression values on the comments area of the price chart.
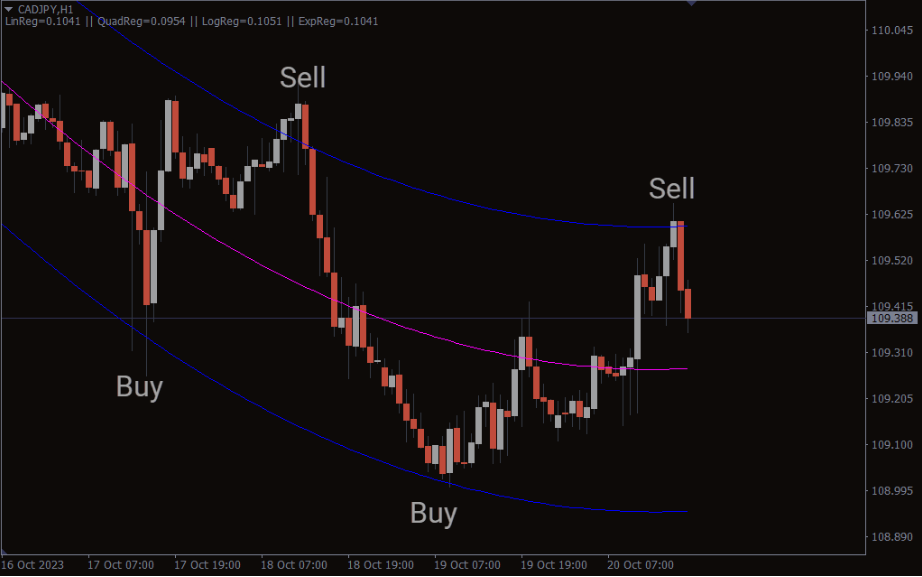
Regression analysis anticipates price to stay around the mid line of the regression band. However, prices tend to stay within the regression bands most of the time. So, the trading strategy is to enter and exit the markets once price hits the upper or lower regression band.
If the price hits the lower regression band, traders should look for a reversal signal and enter a buy trade. A stop loss should be placed below the previous swing low to secure this trade. On the other hand, traders should look to book profits once price hits the upper band.
Similarly, traders can enter a sell position of the price hits the upper regression band.
Conclusion
In summary, the B Regression analysis V2 indicator for MT4 is an effective and essential tool for forex traders using regression based entry rules. However, it is interesting as this indicator automatically chooses the best regression method.


Reviews
There are no reviews yet.