Bollinger Band Bars Indicator
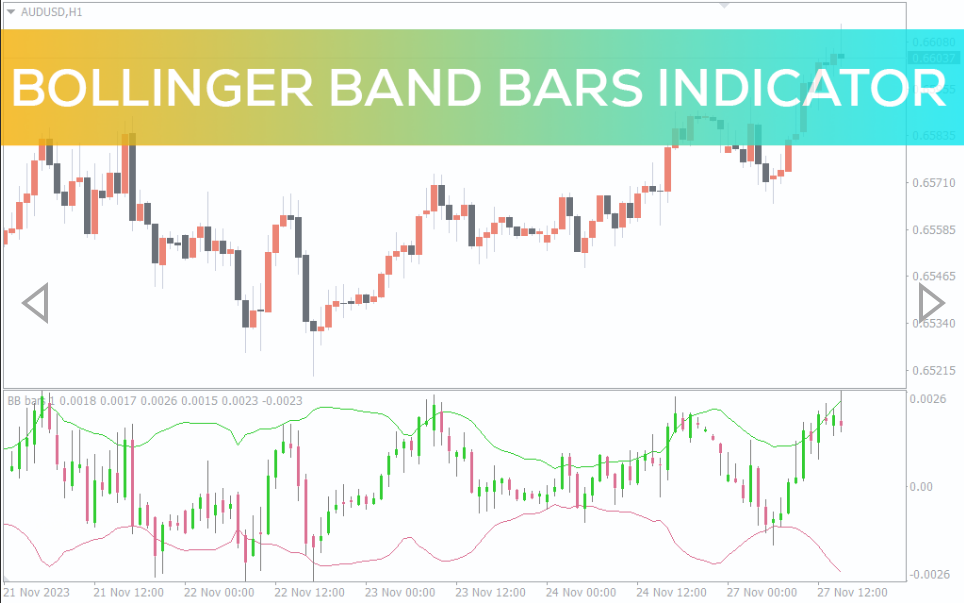
Bollinger Band Bars Indicator For MT4 plots a mini price chart in separate window and plots the Bollinger bands indicator. Best mini charts for confirmation
The Bollinger band bars indicator for MT4 plots a mini price chart with Bollinger bands in a separate indicator window. So, forex traders can use the main chart to plot other technical indicators and trade with confluence of the Bollinger bands indicator.
New forex traders should understand the Bollinger bands trading rules before using this indicator. Furthermore, the indicator works well with all intraday chart time frames and suitable for all types of forex traders. Moreover, Bollinger bands are an integral part of many available automated forex trading strategies.
Bollinger Band Bars Indicator For MT4 Trading Signals
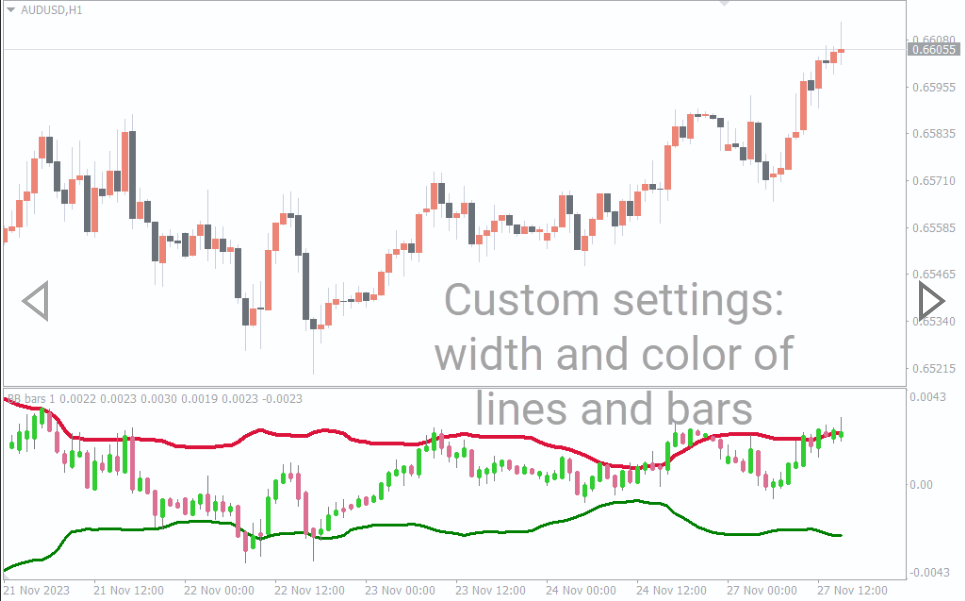
The indicator plots the upper band as green and the lower Bollinger band as red. It plots the bullish candlesticks as green and the bearish ones as red. The trading strategy is exactly as the Bollinger band trading rules, but the trader can add any other indicator for additional confirmation.
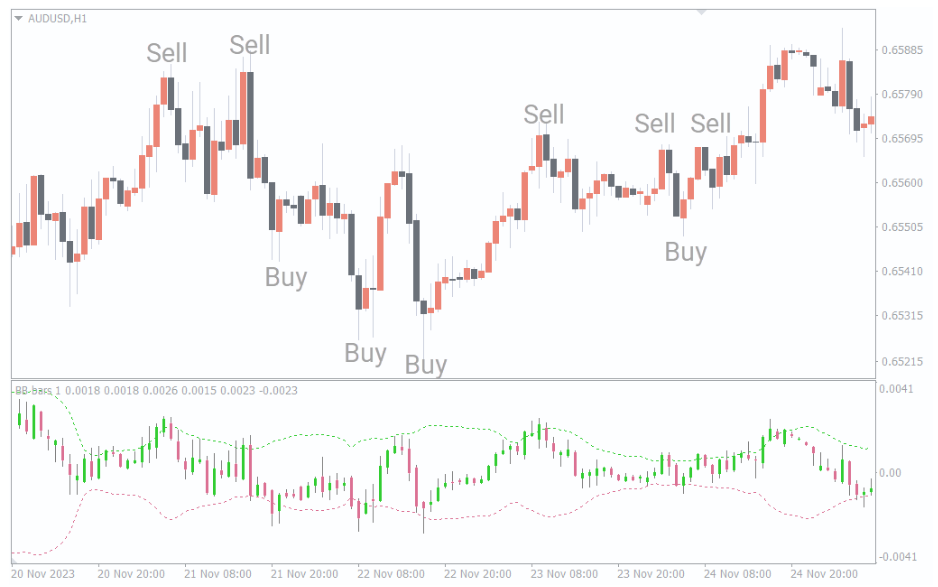
Bollinger bands trading rules state that the more the volatility the bands expands reflecting the volatility. If the Bollinger bands squeeze and the volatility reduce expect a big explosive move soon. Prices tend to move in between the upper and lower bands. If price breaks along the upper or lower band, then it is expected to continue to move in the same direction.
So, forex traders can enter a buy trade if the prices hit the lower band and reverses. Traders should place a stop loss below the previous swing low and book profits at the opposite end of the bands.
Similarly, if prices hit the upper band and reverses traders should enter a sell position using the same stop loss and take profit strategy.
Conclusion
In summary, the Bollinger band bars indicator for MT4 is a mini chart in a separate indicator window

Reviews
There are no reviews yet.