Nice Value Charts Indicator
Nice Value Charts indicator for MT5 automatically detects overbought and oversold zones! Compatible with all markets and timeframes. It doesn’t repaint. Contains warnings.
The Nice Value Charts indicator is another technical oscillator designed to automatically identify overbought and oversold zones.
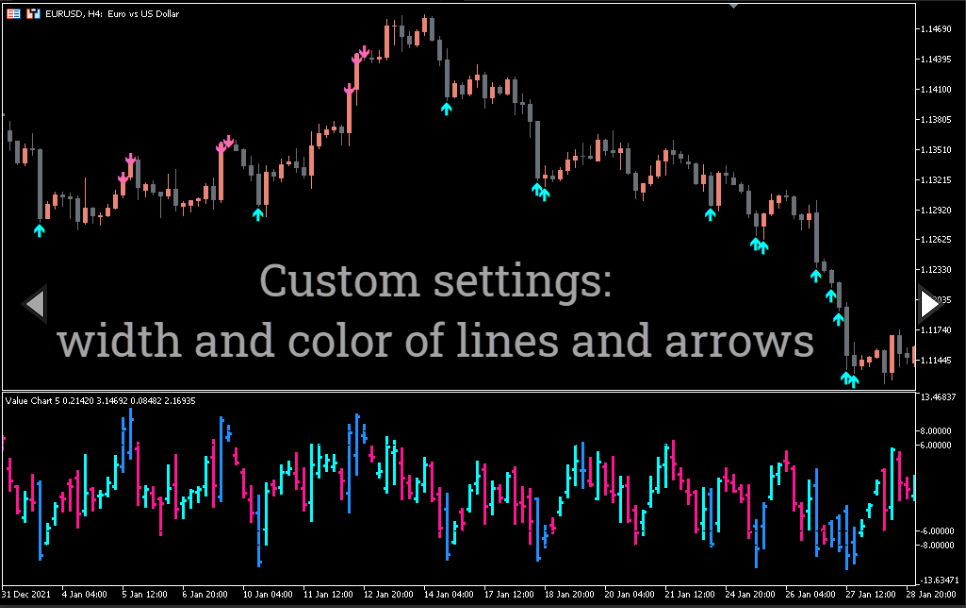
Compared to other oscillators, the Nice Value Charts indicator has one distinctive feature – it is very pleasant to look at.
How to use Nice Value charts for trading
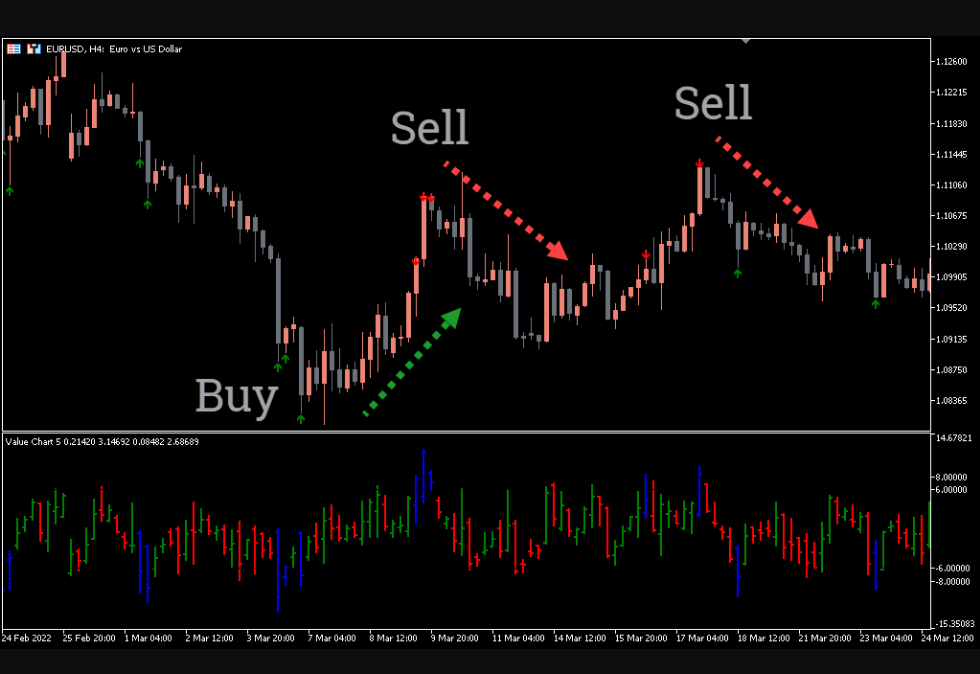
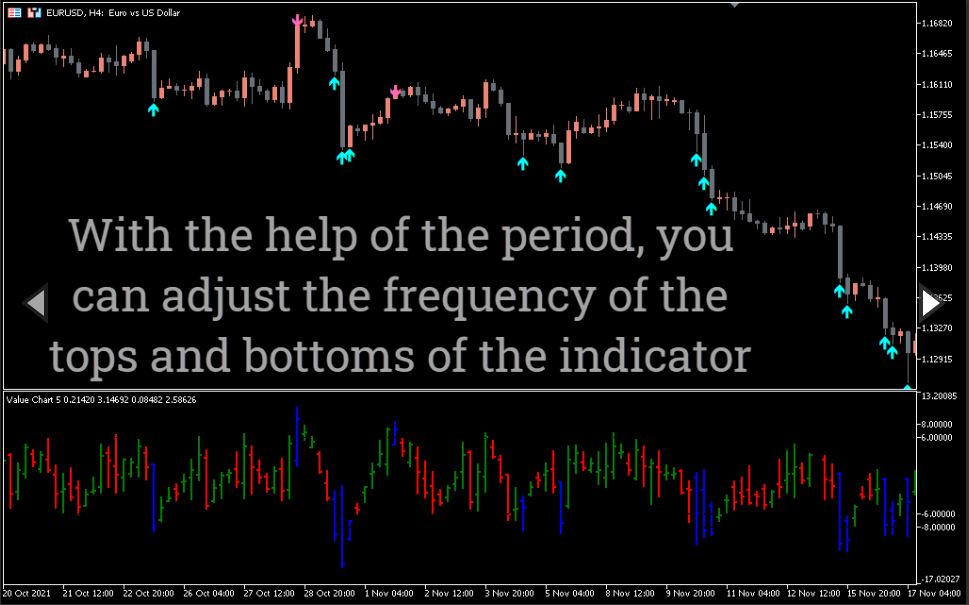
Usually the values of the Nice Value Charts indicator fluctuate around zero.
When the value rises above the overbought line (the indicator bar changes color to green) – this gives a basic sell signal, based on the fact that the price is too high and should go down.
Similarly, the opposite is also true – if the indicator value falls below the oversold line – this gives a basic buy signal. At the same time, the indicator bar changes color to red. By opening a long position based on this signal, the forex trader makes the assumption that the asset is too cheap and should rise in price.
How accurate are the underlying signals?
The Nice Value Charts indicator has a common problem:
A sell signal may mean that the market is entering (or has already entered) a bullish trend. And the expectation of a bearish reversal may not come true and bring losses.
The reverse is also true. A buy signal from an oversold zone can result in a loss if the market enters (or has entered) a bearish trend.
To combat this problem, it is recommended to use additional chart analysis methods, such as chart patterns, support and resistance levels, and/or other indicators as filters.
This should improve the chances that trading the Nice Value Charts Indicator’s main signals will make a profit rather than a loss.
The examples below will give more clarity.
Good value charts are sell signals
A sell signal is given when:
The market is in a bearish trend.
The oscillator enters the overbought zone
In this case, enter a short position when the price turns down (for example, falls below the low of the previous bar). A stop loss can be set just above the bar where the indicator gave an overbought signal.
If the market resumes a bearish trend, the indicator will periodically enter oversold territory – use this indication (indicated by the numbers 1, 2 and 3) as a signal to lower the stop loss level to protect rising profits.
Close the position when the desired profit is reached or the market signals the end of the trend. Choose the risk management method that best suits your personal preferences.
Nice Value Charts Buy Signal
A buy signal comes when:
The price is near the support level.
Nice Value Charts falls below the oversold level.
The example above EUR/USD H1 shows a buy signal that meets the described conditions. You can find a more accurate entry point to a long position on the lower timeframe.
You can also place a protective stop loss below the bar where the oversold condition was recorded.
You can exit a position with a profit when you receive a counter signal in the resistance area (as shown on the chart) or using:
trailing stop-stop;
fixed take-profit.
Conclusion
The Nice Value Charts Metatrader indicator will help you buy the lows and sell the highs. The indicator automatically monitors the moments when the price enters the overbought and oversold zones.
You must be logged in to post a review.

Copyright 2025
Reviews
There are no reviews yet.