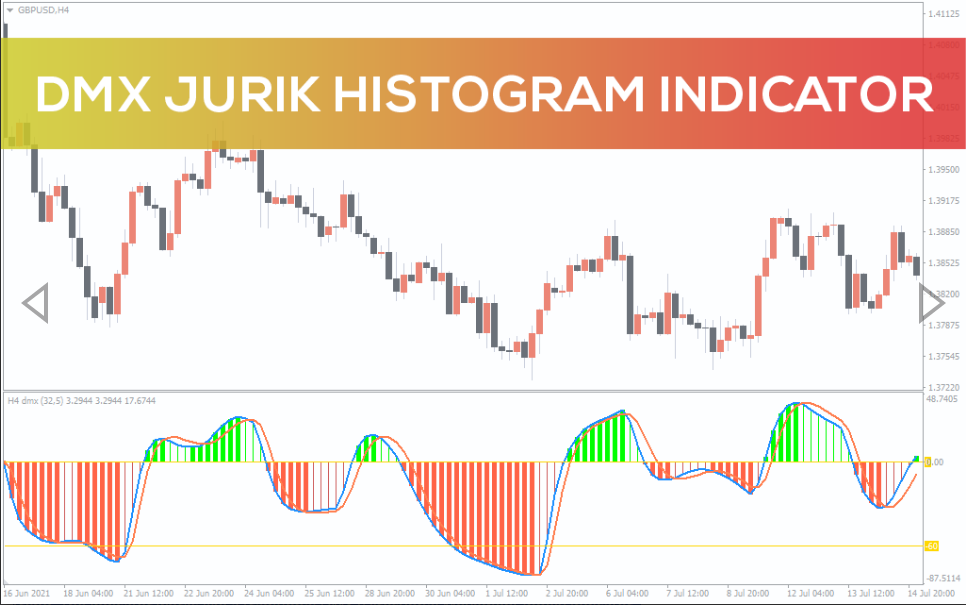
DMX Jurik Histogram Indicator
Forex BUY SELL signals from the best DMX Jurik Histogram Indicator. Uses a moving average and histogram for trend direction. Accurate trend indicator.
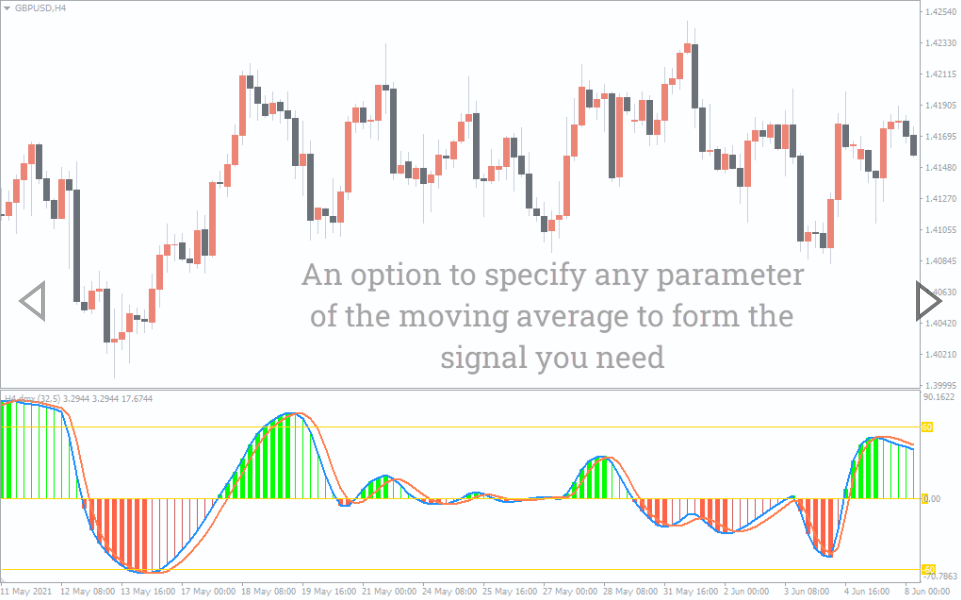
The DMX Jurik Histogram Indicator is a simple MT4 indicator that uses a moving average and a histogram to tell the direction of the trend. The indicator works like a traditional DMX (Directional Movement Index) indicator.
The indicator produces a signal by comparing previous highs and lows and forming a positive directional movement line (+DI) and a negative directional movement line (-DI). The average directional indicator (ADX), an additional third line, can also be used to determine the trend’s strength.
The indicator’s histogram shows red and green bars in the side window to tell the direction of the trend. The red bars mark a bearish trend, while the green bars mention a bullish trend.
The indicator oscillates between -60 and +60 to present overbought and oversold levels. Whenever the indicator falls below -60, it’s an oversold level. On the flip side, when the indicator is +60, it’s in overbought territory.
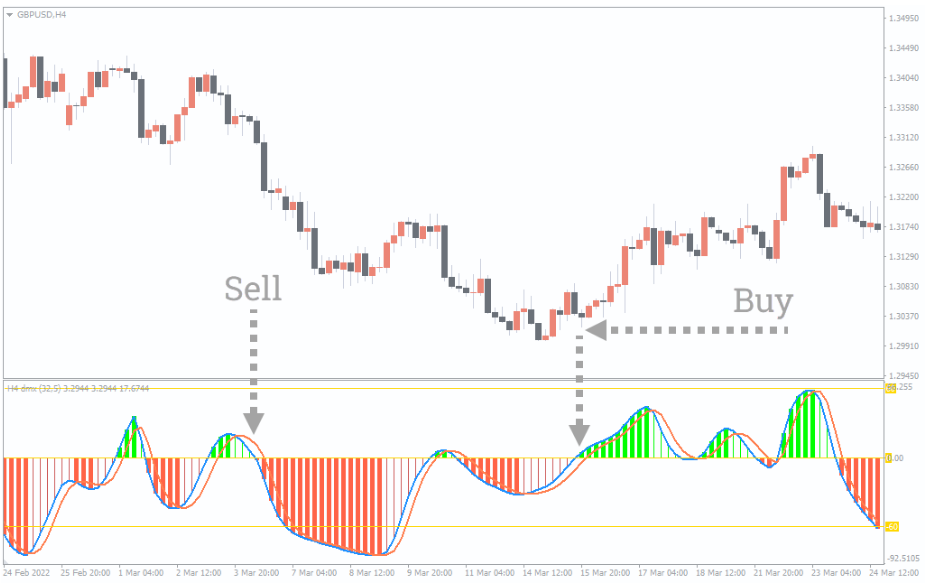
DMX Jurik Histogram Indicator BUY/SELL signals
The above GBP/USD H4 chart shows BUY and SELL signals with the indicator. The DMX Jurik Histogram Indicator indicates the bearish and bullish trend oscillating in overbought and oversold territory.
It is a bearish trend whenever the red bars appear, and the Histogram falls below -60. On the other hand, when the green bars pop up, and the indicator is above +60, it’s a bullish sign, and traders can go long.
One can also use the indicator for spotting market reversals. Traders can exit their long or short positions whenever the indicator changes color.
Conclusion
The DMX Jurik Histogram Indicator for MT4 works like a traditional DMX indicator and tells overbought and oversold levels. Traders can download the indicator for free.


Reviews
There are no reviews yet.