The Grid indicator for MetaTrader 4 is a custom tool that automatically draws customized grid lines and period separators on the chart.
The Grid indicator for MetaTrader 4 is a custom tool that automatically draws grid lines and period separators on the chart. It works similarly to the traditional grid lines on the MT4 platforms but has more flexible customization options like grid spacing, for instance.
What is the Horizontal Grid Lines Indicator for MT4?
The horizontal grid lines indicator is simply a technical tool that continuously plots horizontal lines across the chart. However, the Grid indicator is outstanding because it plots both horizontal lines and highlights different trading periods of past price action for easy reference. Besides, it also identifies the 00-levels, otherwise known as the psychological zones, where significant trading activities are done by the big banks, hedge funds, etc.
How to Use the Grid Indicator
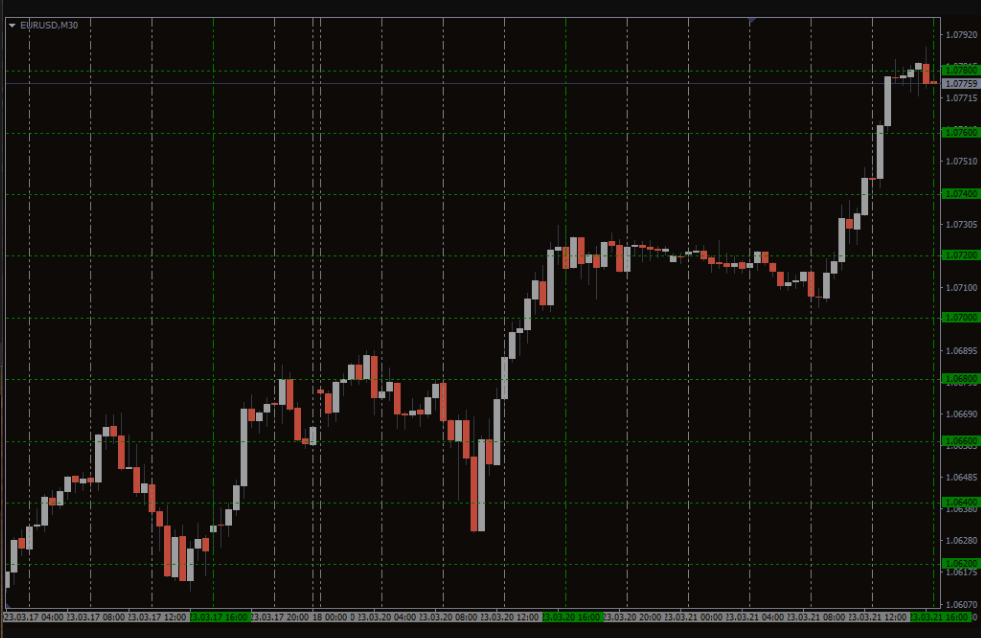
The above image shows the Grid indicator in action on the EURUSD currency pair. The green horizontal lines are the psychological zones, while the gray vertical lines depict the trading periods of past price actions. The spacing period between the horizontal lines is 20 pips; however, you may customize the spacing to suit your trading style.
Conclusion
The Grid indicator for MT4 may look somewhat insignificant in the forex market; however, it does convey some hidden information to make a better trading decision. What’s more, it is free to download.
Reviews
There are no reviews yet.
Be the first to review “Grid Indicator” Cancel reply
We use cookies to ensure that we give you the best experience on our website. If you continue to use this site we will assume that you are happy with it.Accept


Reviews
There are no reviews yet.