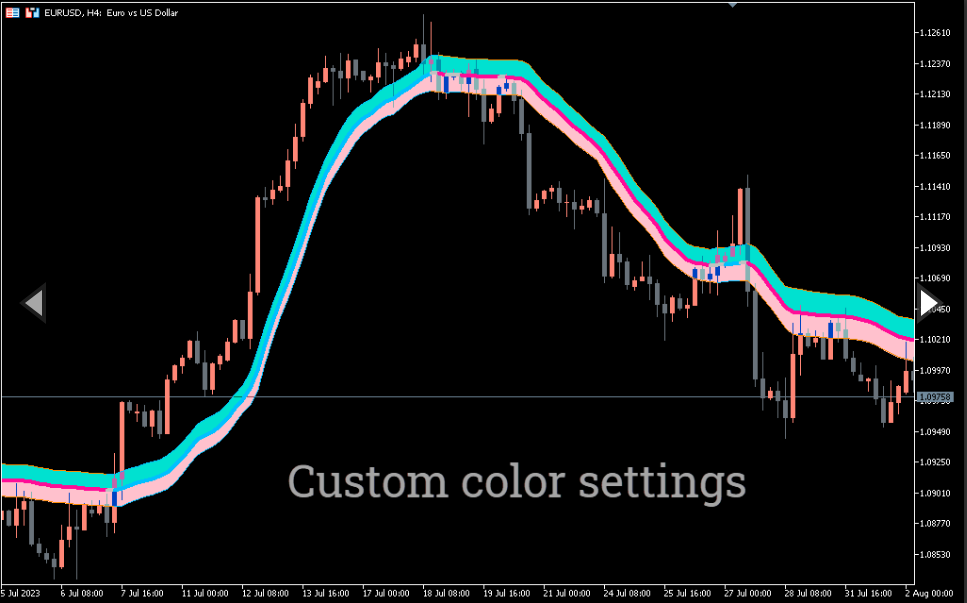
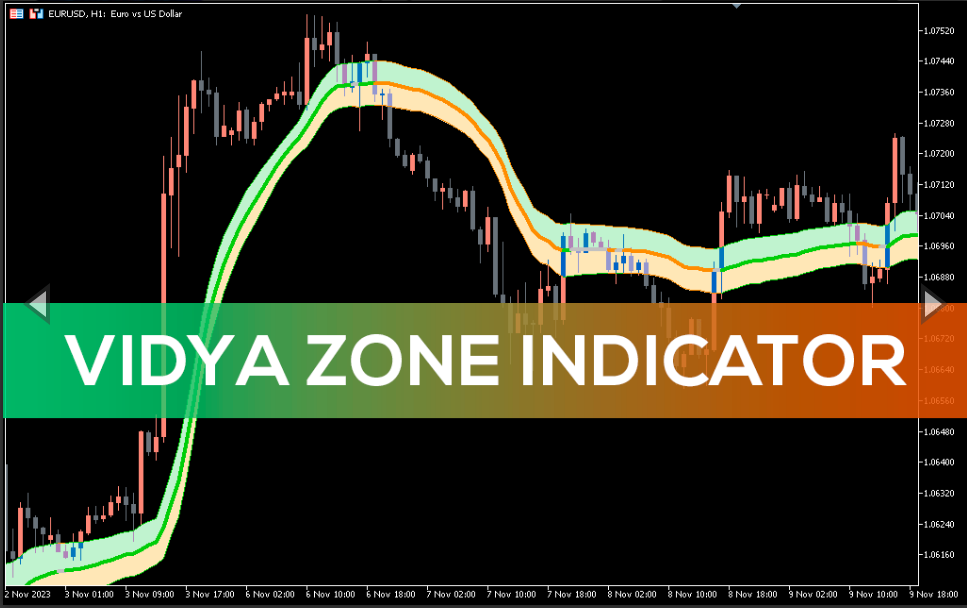
Vidya Zone Indicator
The Vidy Zone indicator for MT5 provides support and resistance zones. The Best Forex Buy and Sell Trading Signals for Support and Resistance Traders
The Vidya Zone indicator for MT5 uses the Chande Momentum Oscillator (CMO) to create support and resistance zones. Additionally, it plots a trend line to determine the current trend direction. As a result, Forex traders receive high-quality trading signals to buy and sell when these support or resistance zones are broken.
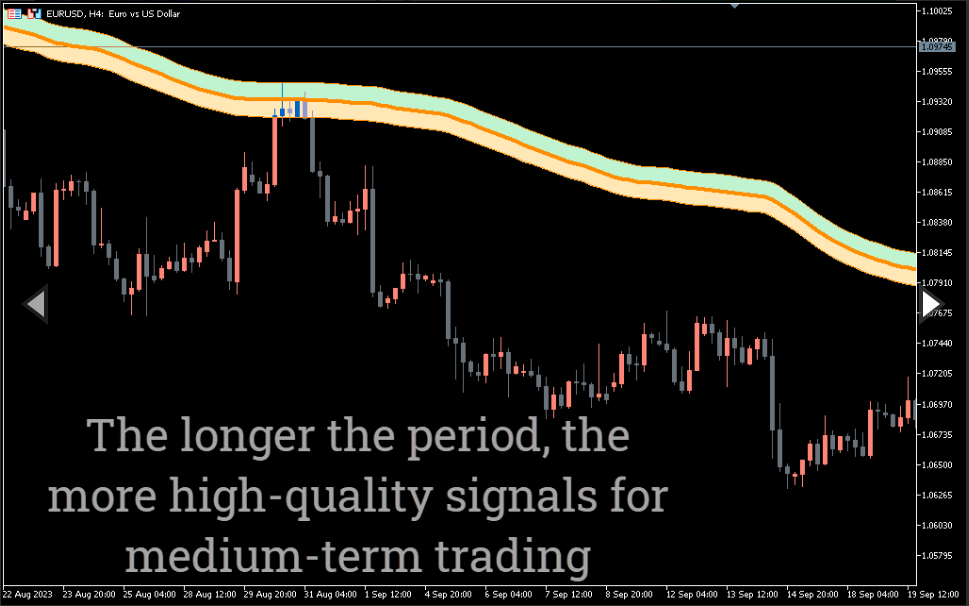
The indicator works well on all intraday price charts, as well as daily, weekly and monthly price charts.
It is easy to identify and follow for both new and experienced Forex traders. In addition, traders can use the indicator to build automatic trading strategies.
Vidya Zone Indicator For MT5 Trading Signals
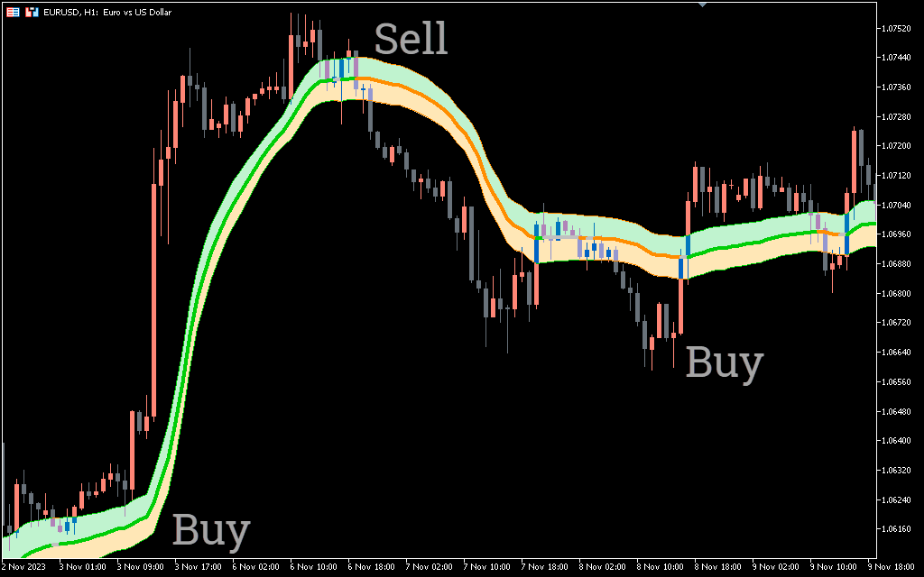
The indicator displays the channel with a green or orange upper, lower and middle line. The upper and lower lines of the channel act as support or resistance lines in relation to the price. However, the middle line acts as a trend line. The trading strategy is to buy or sell as soon as the price breaks above or below the zone.
If the price closes above the channel and the lines turn green, traders should enter the market with a buy trade. The stop loss should be placed below the previous swing low and take profits on the opposite trading signal.
Traders should apply a similar trading strategy if the price closes below the support and resistance zones and the indicator turns orange. Since the indicator applies a smoothing filter, trading signals are stable and profitable.
Conclusion
Thus, Vidy Zone Indicator for MT5 helps forex traders to identify support and resistance zones. It is an effective and interesting trading tool for forex traders with support and resistance.


Reviews
There are no reviews yet.