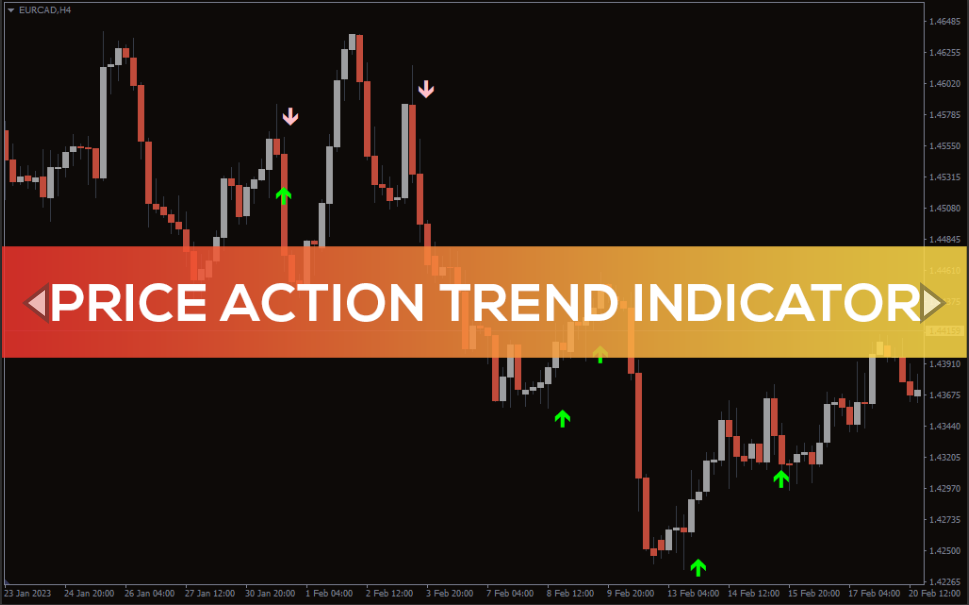
Forex BUY/SELL signals from the best Price action trend Indicator for MT4. Find the trend’s direction with the help of arrows
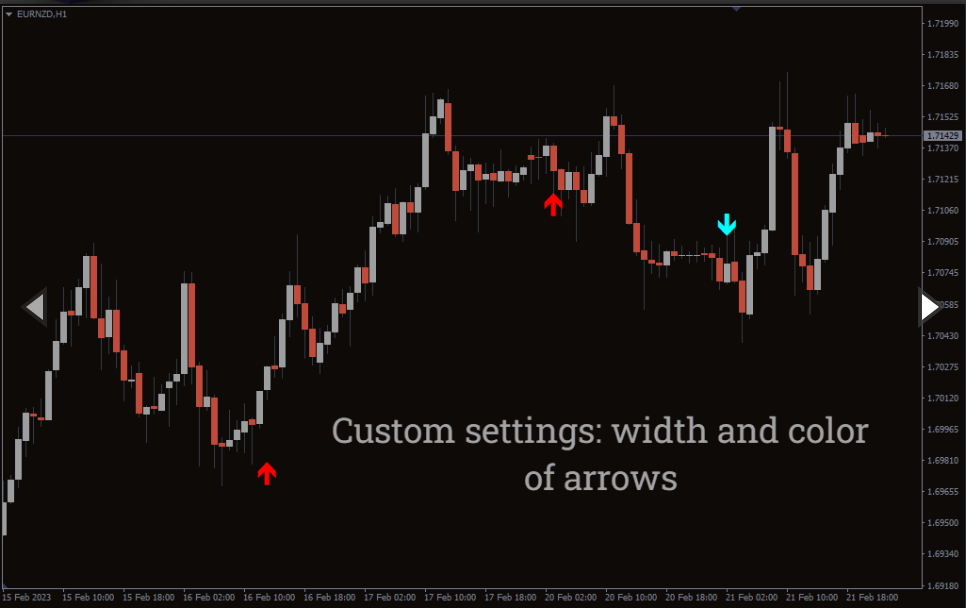
The Price action trend Indicator is a simple MT4 indicator that plots arrows to determine the direction of the trend. The indicator shows two arrows; up (lime) and down (pink). By looking at the arrows, you can enter the trade.
The good thing is Indicator works on all timeframes; however, it can be prone to false signals on shorter timeframes. So, to use the indicators for scalping or short-term trading, you can locate the overall trend on a longer timeframe and then take the trade.
How to use the Price action trend Indicator for MT4?
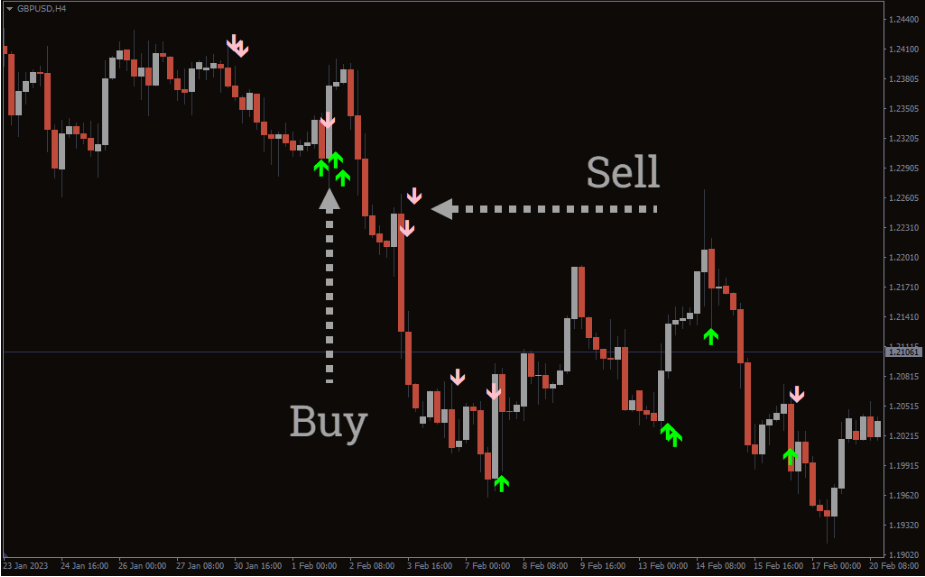
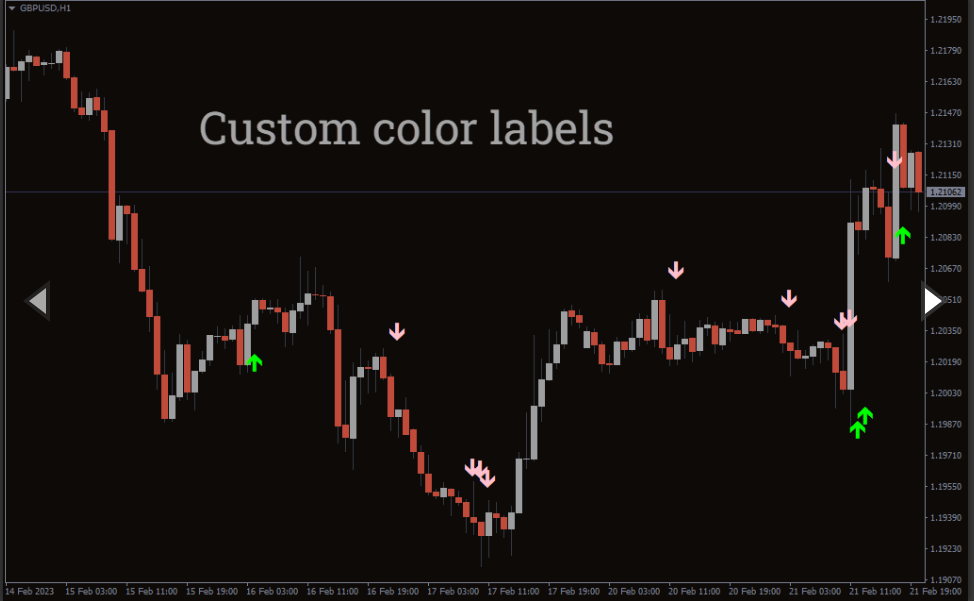
The above GBP/USD H4 chart shows the Indicator’s BUY/SELL signals. To determine BUY/SELL signals, you only need to look at the arrows. If the up (lime) arrow appears, you can take a long position. Conversely, you can go short if a down (pink) arrow pops up. It’s important to note that Indicator can repaint, meaning it can show an arrow during the formation of the candlestick but disappear when the candlestick ends.
Therefore, you need to wait for the trend to continue and then enter. Also, you can combine other indicators like the MACD or RSI for trend confirmation. Another key factor to consider is, Indicator can plot several arrows within a trend. For instance, the indicator can show lime or pink color arrows in a downtrend. These arrows can act as a trend continuation or a reversal.
Conclusion
The Price action trend Indicator for MT4 simply plots up and down arrows to find the trend’s direction. The indicator can present clear entry and exit points. You can download the Price action trend Indicator for free from our website.
Reviews
There are no reviews yet.
Be the first to review “Price action trend Indicator” Cancel reply
We use cookies to ensure that we give you the best experience on our website. If you continue to use this site we will assume that you are happy with it.Accept

Reviews
There are no reviews yet.