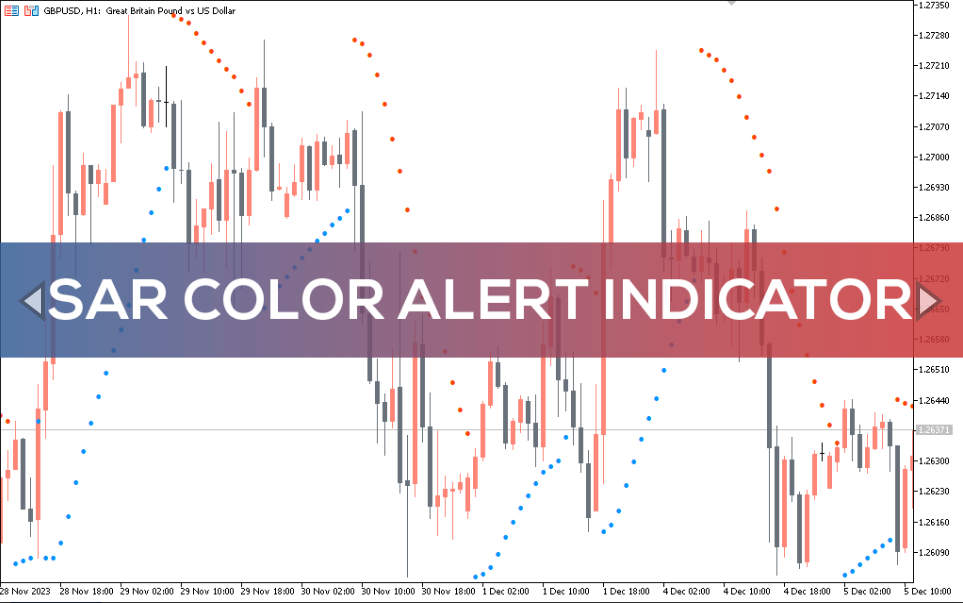
SAR Color Alert Indicator
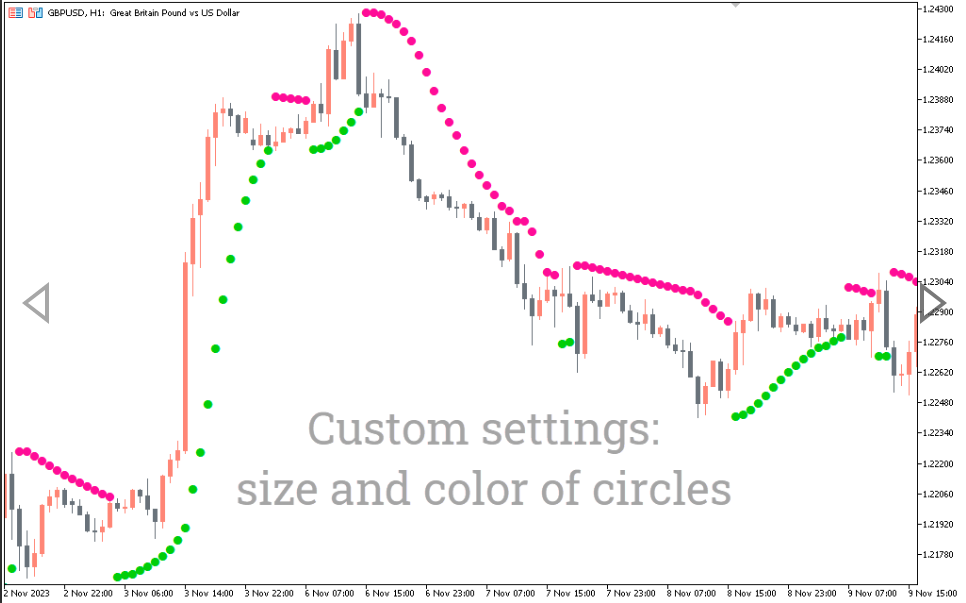
The SAR Color Alert indicator is a parabolic SAR indicator that displays a blue and red parabola (dot) on the chart.
The SAR Color Alert indicator is a variation of the popular Parabolic SAR indicator. The regular Parabolic SAR indicator, also known as the stop and reversal indicator, draws a parabola (point) below/above the price to indicate an uptrend and a downtrend respectively.
Is SAR a good indicator?
The Parabolic SAR indicator is commonly used in the financial market to track the current direction of the market and determine the end/beginning of a new trend. It is also used as a signal to enter or exit a trading position.
However, one of the disadvantages of the traditional Parabolic SAR is that it has one color for uptrend and downtrend signals, which can be awkward when used among other technical indicators.
Thus, the SAR Color Alert indicator is a parabolic SAR designed with a dual-color feature to display the uptrend and downtrend of the instrument in different colors. Thus, a bullish trend is depicted by a blue parabola, and a bearish trend by a red parabola.
How to trade using the SAR Color Alert indicator
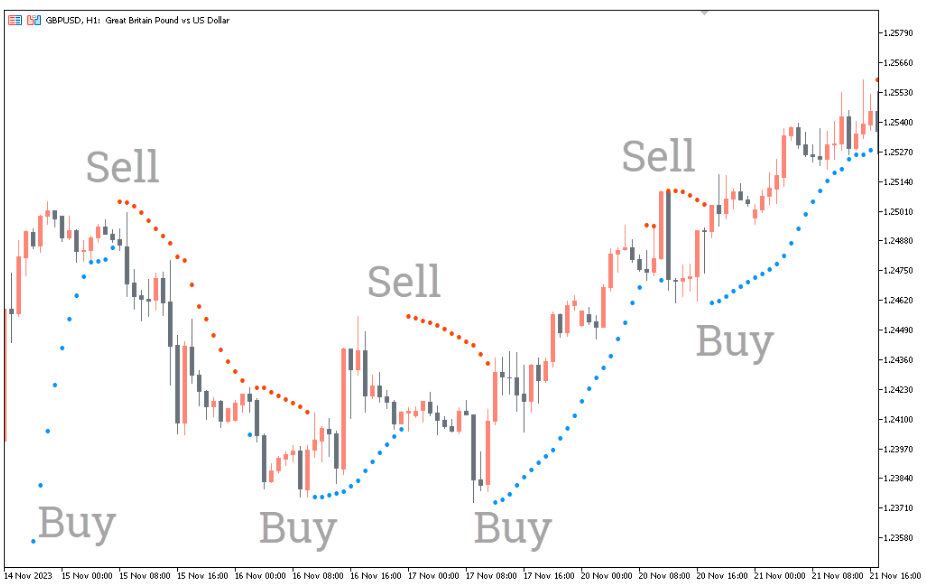
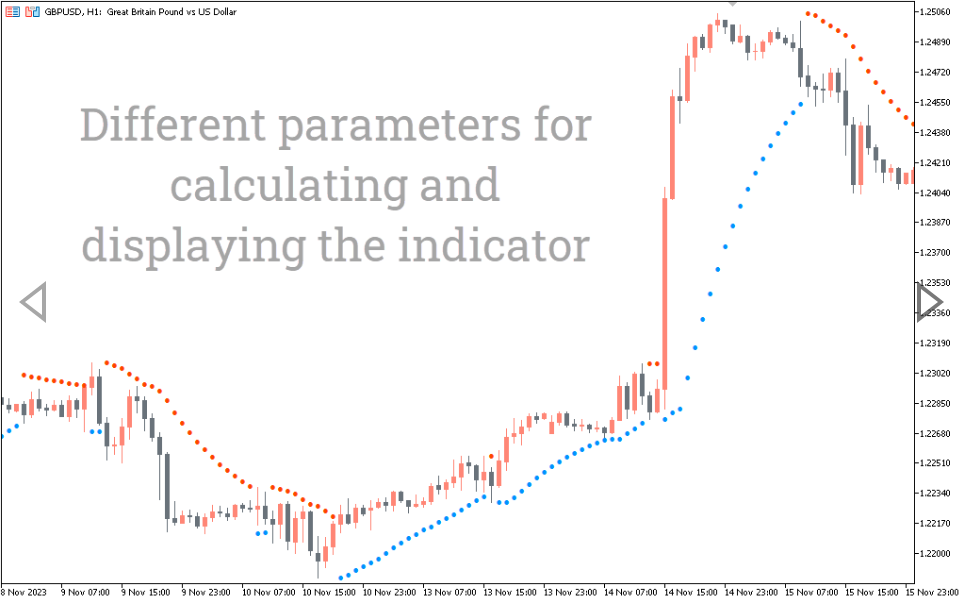
The attached image is a color SAR alert indicator; it draws a blue parabola for an uptrend and a red one for a downtrend. The indicator can also send notifications when a trend reverses.
Therefore, open a buy/sell trading position when the blue/red parabola is displayed below/above the candle. However, for greater effectiveness, it is recommended to combine the indicator with price action or other trend analysis indicators.
In addition, it is worth noting that this indicator provides better market analysis/signals to enter a stable trend state (bullish/bearish).
Conclusion
The SAR Color Alert indicator is a beginner-friendly technical tool that displays parabolas in two different colors for bullish and bearish trends. Finally, it can be downloaded for free.

Reviews
There are no reviews yet.