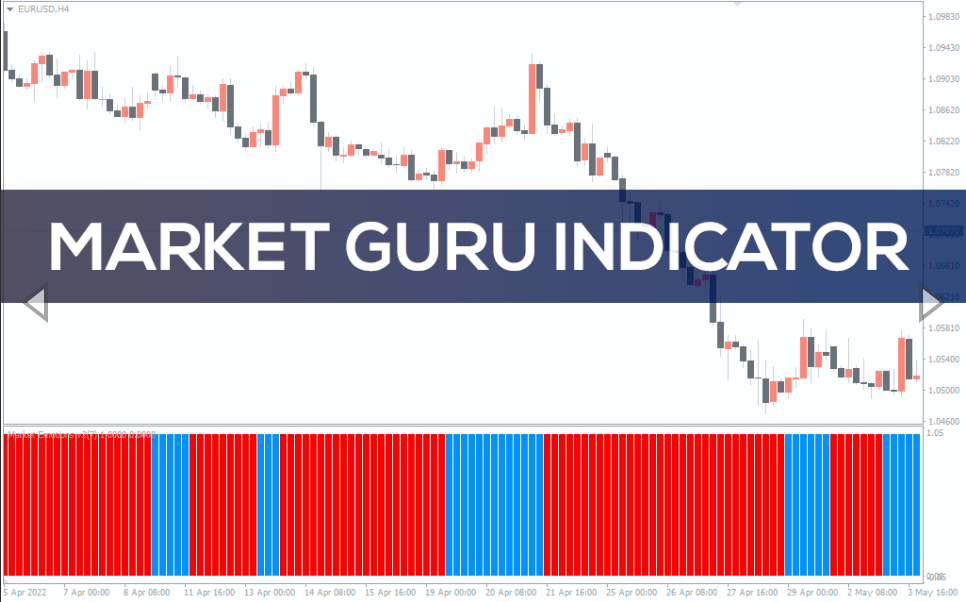
Market Guru Indicator
Market Guru indicator for mt4 – download free. Accurate trend following indicator. Best non-repaint mt4 indicator.
The Market Guru indicator for MetaTrader is a custom indicator that follows the trend of a financial trading asset. It is chart-friendly, and the signal doesn’t repaint. This makes it one of the most reliable tools for trend analysis.
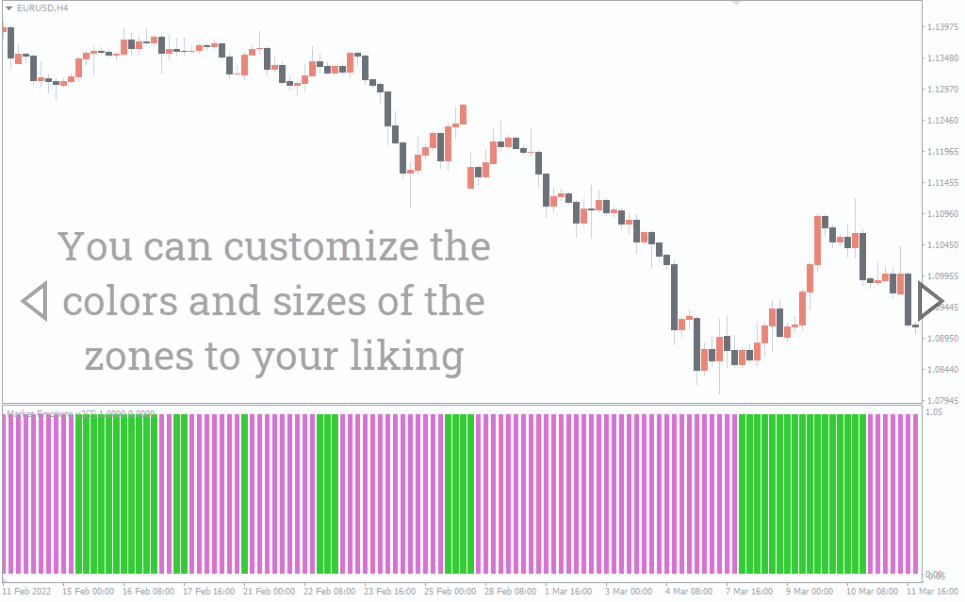
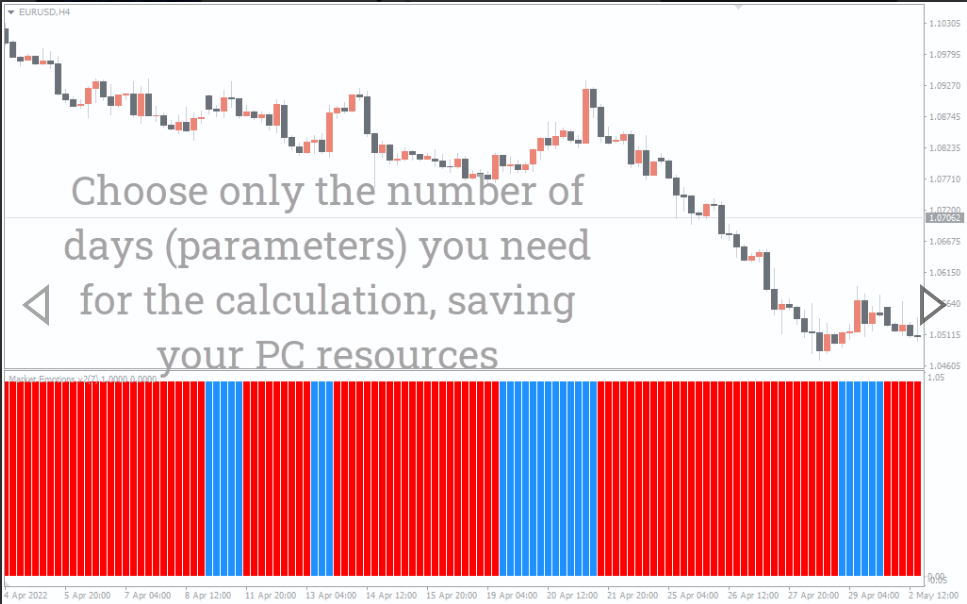
It is built with algorithms that closely monitor and relay the trend direction of the market via histogram bars. The histogram bars portray different market sentiments. The indicator paints dodger blue histogram bars if the market is in a bullish trend. Similarly, it paints red histogram bars when the trend of the market is bearish.
The Market Guru indicator would also come in handy as a momentum trading indicator. In this case, the dodger blue and red histogram may be used to deduce bullish and bearish momentum respectively.
Furthermore, the indicator works well with different trading styles like scalping, day/intraday, and swing trading. The H4 time frame and above are best suited for day/intraday and swing trading; they tend to give more reliable trend biases. Besides, the indicator is suitable for novice, intermediate and experienced traders.
How to Trade With the Market Guru Indicator
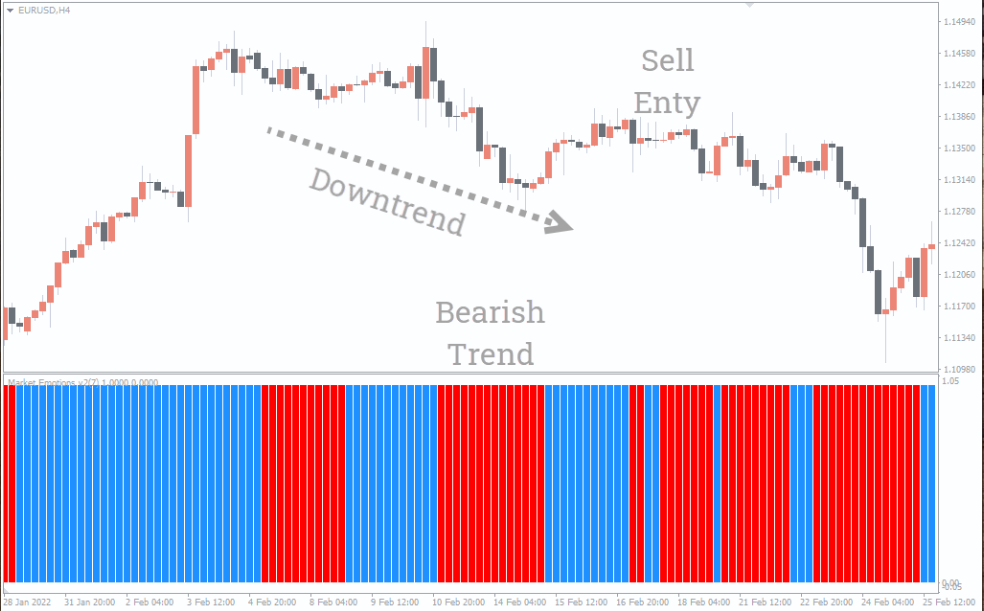
The above screenshot shows how the indicator would look on your MT4 platform. It also demonstrates how to identify good trade setups.
The Market Guru indicator may be used as a stand-alone technical tool for trade entries/exits. Regardless, it is recommended to be used along with price action/other forex technical indicators for better efficiency. It is also important to state that trading in the direction of the trend is one of the surefire ways to achieve consistency.
BUY Signal: Firstly, identify the current trend of the market; in this case, a bullish trend. Now, wait for the indicator to paint the dodger blue histogram bars which signify a bullish move. You may then open a BUY/SHORT position after price action also prints a bullish candlestick pattern (e.g. bullish engulfing).
SELL Signal: Firstly, identify the current trend of the market; in this case, a bearish trend. Now, wait for the indicator to paint the red histogram bars which signify a bearish move. You may then open a SELL/SHORT position after price action also prints a bearish candlestick pattern (e.g. bearish engulfing).
Take Profit and Stop Loss are determined by your trading style. However, it should be realistic; you don’t need to wait for the opposite signal to exit a trade. For instance, a 1:2 risk-to-reward of 30 pips Stop Loss and 60 Pips Take Profit is achievable.
Conclusion
The Market Guru indicator for MT4 is a brilliant technical trading tool that can potentially improve your trading outcome. However, it is recommended to be used in a trending market to filter out the false signals to the minimum. What’s more, it is free to download.

Reviews
There are no reviews yet.