Candle Direction Indicator
Candle Direction Indicator For MT4, shows candle direction of all chart time frames, forex traders easily buy or sell in both bullish and bearish trend.
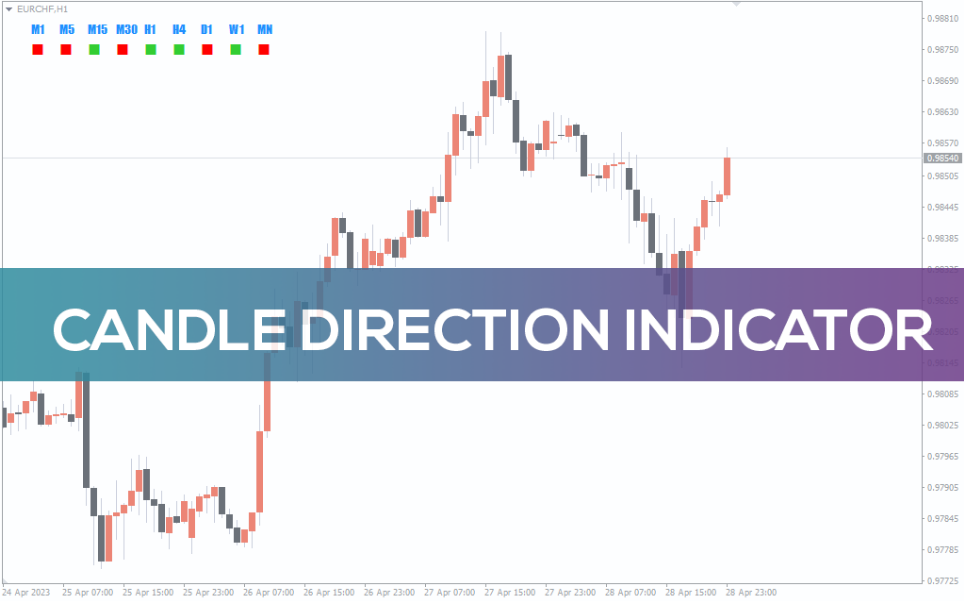
The Candle direction indicator for MT4 checks the candlesticks of all chart time frames and plots them in various colors according to the up, down or neutral candle direction. So, forex traders can easily identify the candle direction of the currency pair in multiple time frames at a glance. This helps forex traders to identify the trend direction in technical analysis.
The indicator plots the direction of the candlestick in three colors. It’s very easy to visually identify the market direction and works well with new and advanced forex traders. The indicator automatically pulls the data from all intraday chart time frames and daily, monthly, weekly price charts. So, traders can place the indicator on any chart.
Candle Direction Indicator For MT4 Trade Setup
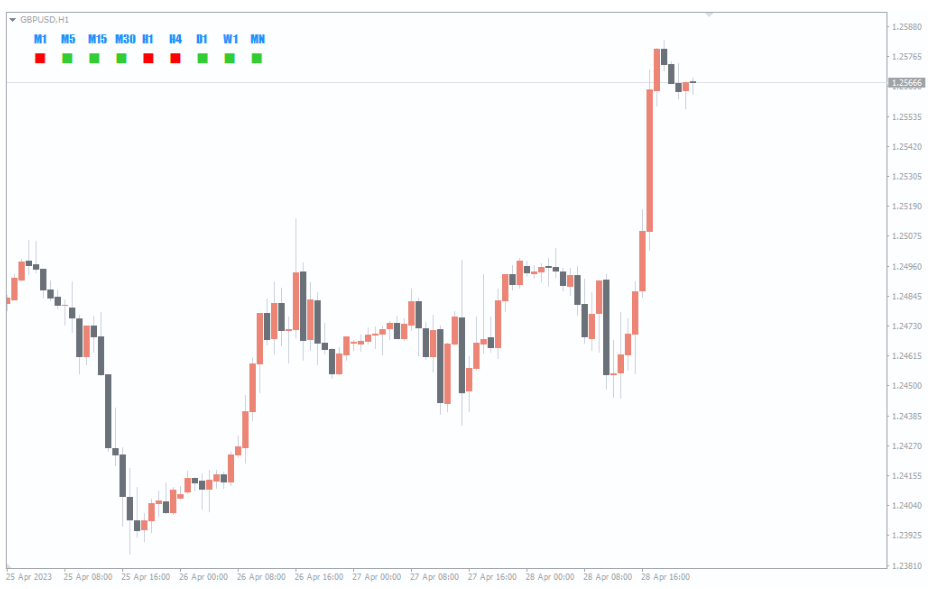
The above GBPUSD H1 candlestick price chart shows the candle direction indicator for MT4 in action. The indicator plots the name of the chart time frames and plots the color of the candles at these time frames in a box below. To summarize, upward candle is in green, downward candle in red and neutral candles are in white.
Obviously, the indicator helps traders to identify trend direction by looking at higher and multiple time frame charts. If, most of the candles show a bullish color traders should enter the market with a buy trade with a stop loss below the previous swing low.
Similarly, when most candles are bearish it shows a bearish market trend. So, forex trend traders should enter sell positions with a stop loss above the previous swing high.
Conclusion
In Summary, the Candle direction indicator for MT4 helps forex traders using multi time frame ( mtf ) trading strategies in technical analysis.

Reviews
There are no reviews yet.