RSI Bands Indicator
he RSI Bands indicator for MT5 is a custom trading tool that detects overbought/oversold zones of the price and also generates a buy/sell entry.
The RSI Bands indicator for MetaTrader 5 is a customizable trading tool that identifies overbought/oversold price zones and generates buy/sell entries. This is different from the regular RSI (Relative Strength Indicator) that comes with the MT5 platforms which only detects overbought/oversold zones.
How do you read the RSI band?
The traditional RSI indicator signals the potential overbought of an asset when the price moves to the 70 level or higher, while the asset is oversold when the price moves to the 30 level or lower.
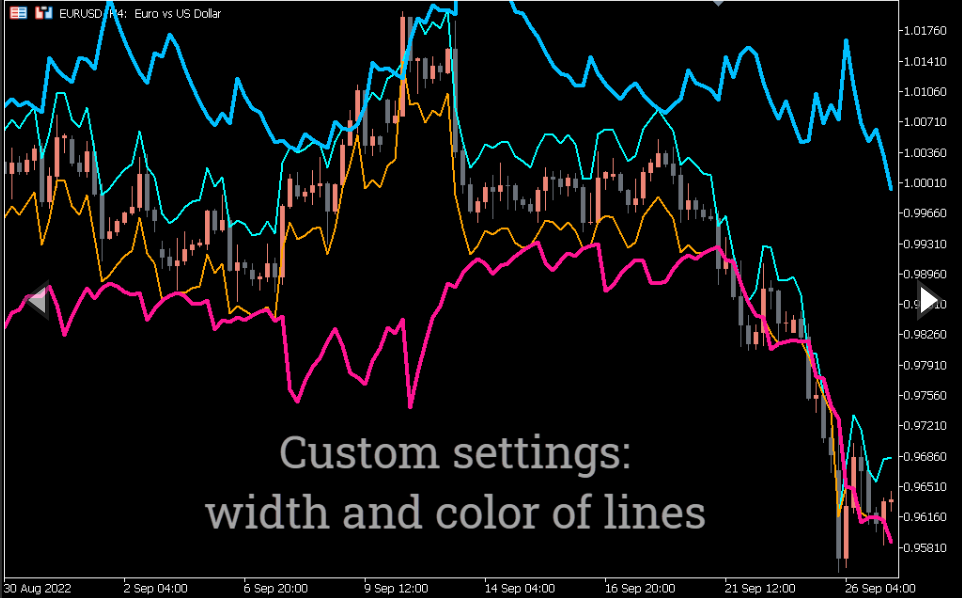
However, this technical indicator (RSI Bands) is unique in that it is built using green and red lines running above and below the main price chart. The indicator draws two lines of each color, one of which is dotted means the damped value and fluctuates along with the price movement to detect the overbought/oversold limit.
In addition, the indicator displays the potential overbought / oversold of the asset when the price chart touches one of the lines. Moreover, the indicator lines can also work as support and resistance lines. However, the indicator is recommended to be used in conjunction with price action/or other technical indicators for greater effectiveness.
How to trade with RSI Bands
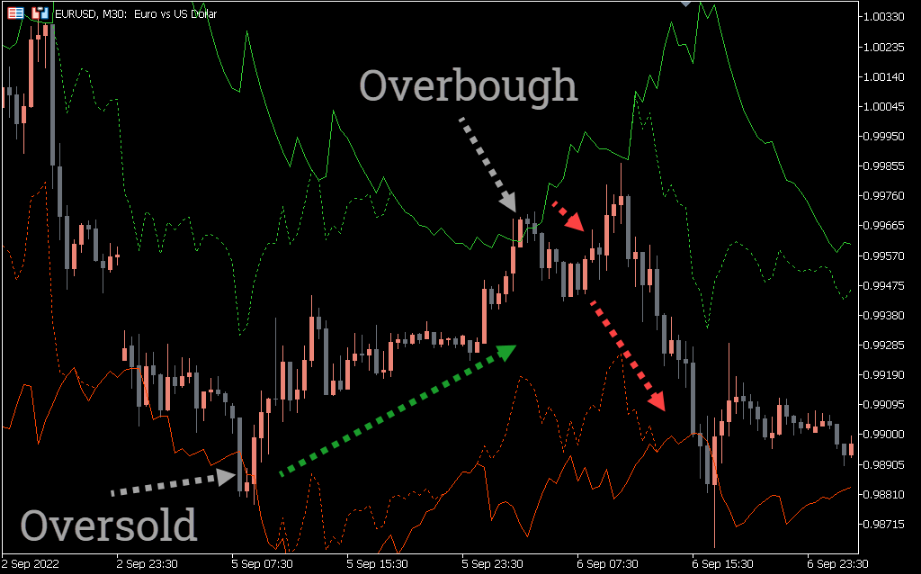
The image above shows the action of the indicator on the EURUSD currency pair on the M30 timeframe. It illustrates how to use the indicator in synergy with price action.
First, the image shows that the indicator lines crossed with the price, which indicates that the price has entered the potential overbought zone. In addition, after the crossover, the price also closed below the lines, further suggesting a possible trend reversal.
In addition, the price has created a supply zone and retested it, which also indicates a possible bearish move. Finally, a sell entry was confirmed after the bearish candle closed below the supply zone.
Conclusion
The RSI Bands Indicator for MT5 is a dynamic Forex trading tool that detects extreme trend conditions in the financial market. In addition, it is suitable for scalpers, day/intraday and swing traders when doing technical analysis. Finally, it’s free to download.
You must be logged in to post a review.

Copyright 2025

Reviews
There are no reviews yet.