RSI Ob Os Arrows Alerts Indicator
Unlock Trading Insights with RSI Ob Os Arrows Alerts Indicator for MT4. Pinpoint market reversals with customizable alerts and easy-to-read signals.
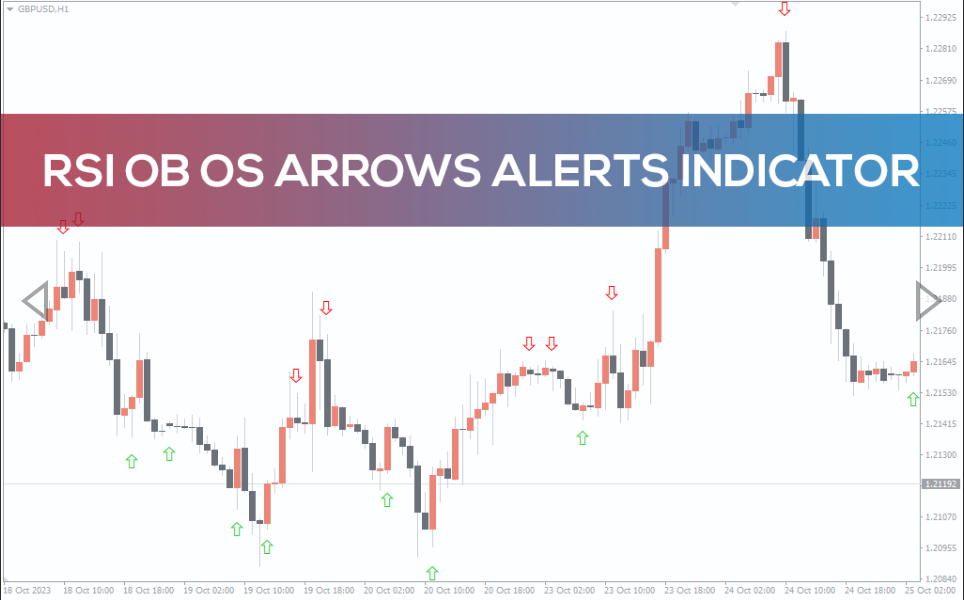
The RSI Ob Os Arrows Alerts Indicator for mt4 is a custom indicator that shows arrows and alerts when the Relative Strength Index (RSI) crosses into an overbought or oversold area. It is a popular forex indicator because it can assist you in identifying probable market reversals.
How To Use The RSI OB OS Arrows Alerts Indicator
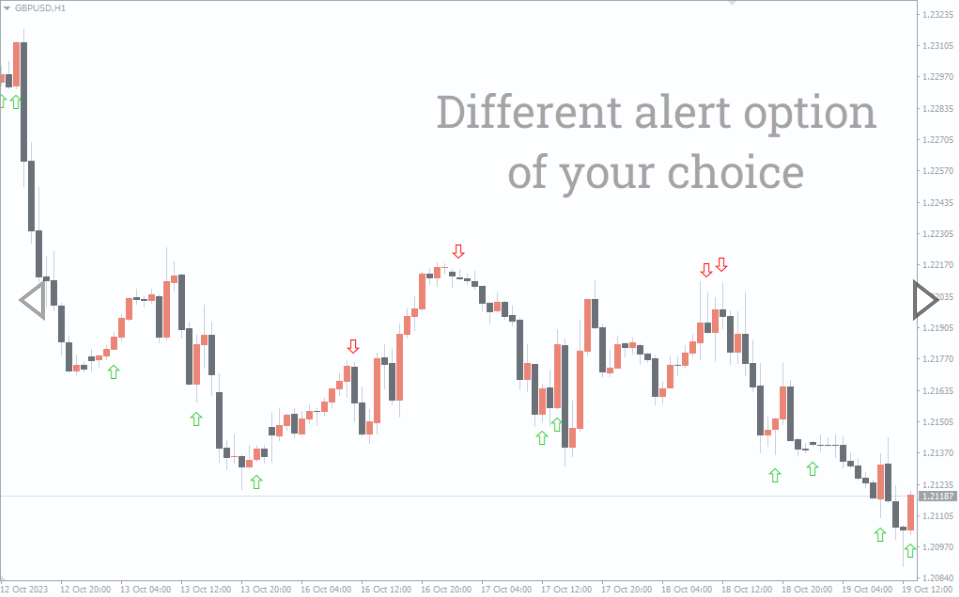
Once you add the indicator to a chart, it will display arrows and warnings when the RSI enters an overbought or oversold zone. Oversold arrows will be green, while overbought arrows will be red. The indicator delivers the warnings via pop-up, email, or SMS.
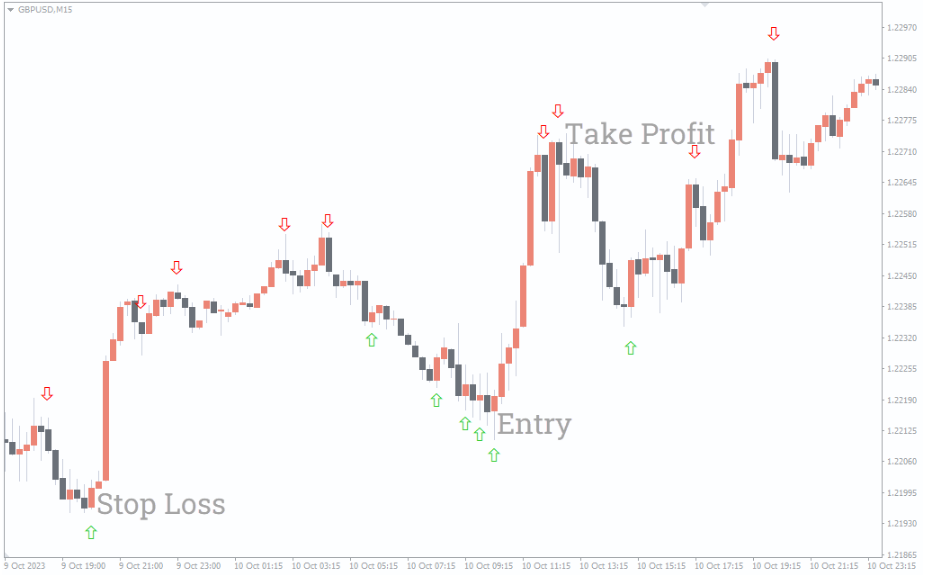
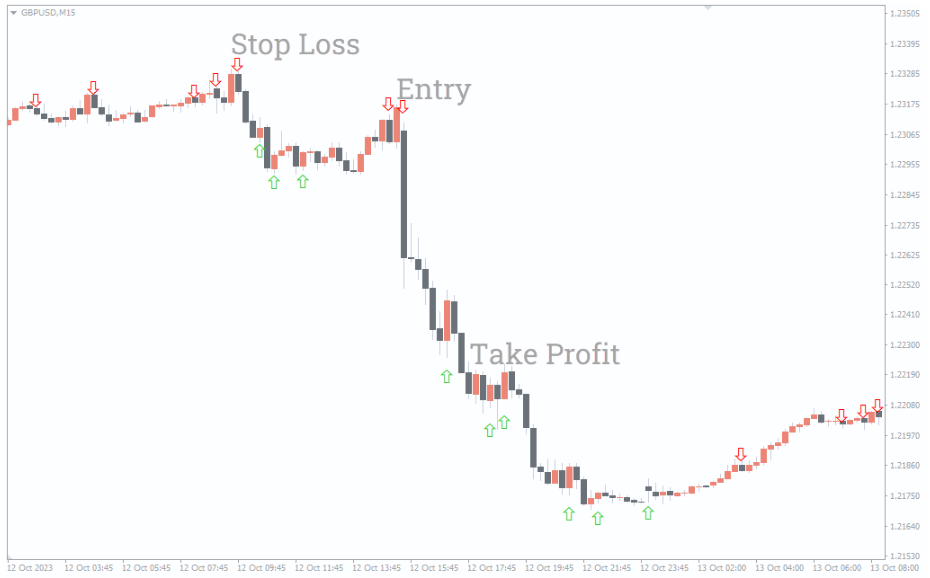
You can use the indicator to spot impending market reversals. For example, if the RSI is above 70 and the indicator gives an overbought alert, the market may be due for a drop. Enter a short trade and place your stop loss above the previous high. Place the take profit based on your risk-reward ratio.
In contrast, if the RSI is below 30 and the indicator sends an oversold alert, the market may be due for a bounce. Enter a long trade and place your stop loss on the previous low. Place the take profit based on your risk-to-reward ratio.
Conclusion
The RSI Ob Os Arrows Alerts Indicator displays colored arrows on the chart indicating when the price is oversold or overbought. You can use these arrows to enter trades.The RSI Ob Os Arrows Alerts Indicator for mt4 is a custom indicator that shows arrows and alerts when the Relative Strength Index (RSI) crosses into an overbought or oversold area. It is a popular forex indicator because it can assist you in identifying probable market reversals.
How To Use The RSI OB OS Arrows Alerts Indicator
Once you add the indicator to a chart, it will display arrows and warnings when the RSI enters an overbought or oversold zone. Oversold arrows will be green, while overbought arrows will be red. The indicator delivers the warnings via pop-up, email, or SMS.
You can use the indicator to spot impending market reversals. For example, if the RSI is above 70 and the indicator gives an overbought alert, the market may be due for a drop. Enter a short trade and place your stop loss above the previous high. Place the take profit based on your risk-reward ratio.
In contrast, if the RSI is below 30 and the indicator sends an oversold alert, the market may be due for a bounce. Enter a long trade and place your stop loss on the previous low. Place the take profit based on your risk-to-reward ratio.
Conclusion
The RSI Ob Os Arrows Alerts Indicator displays colored arrows on the chart indicating when the price is oversold or overbought. You can use these arrows to enter trades.
You must be logged in to post a review.

Copyright 2025
Reviews
There are no reviews yet.