Connors RSI Indicator
Connors RSI is a more advanced RSI that uses a relatively shorter period to react to price changes. An ideal overbought and oversold area identifier.
The Connors RSI is an enhanced version of the conventional RSI developed by Larry Connors. It uses period 2, making it reacts faster to the price changes. The overbought area is set at 90, while the price enters an oversold region if it falls below 10. This is quite different from other RSI, which uses period 14 and sets oversold are below 330 while the oversold area is above 70.
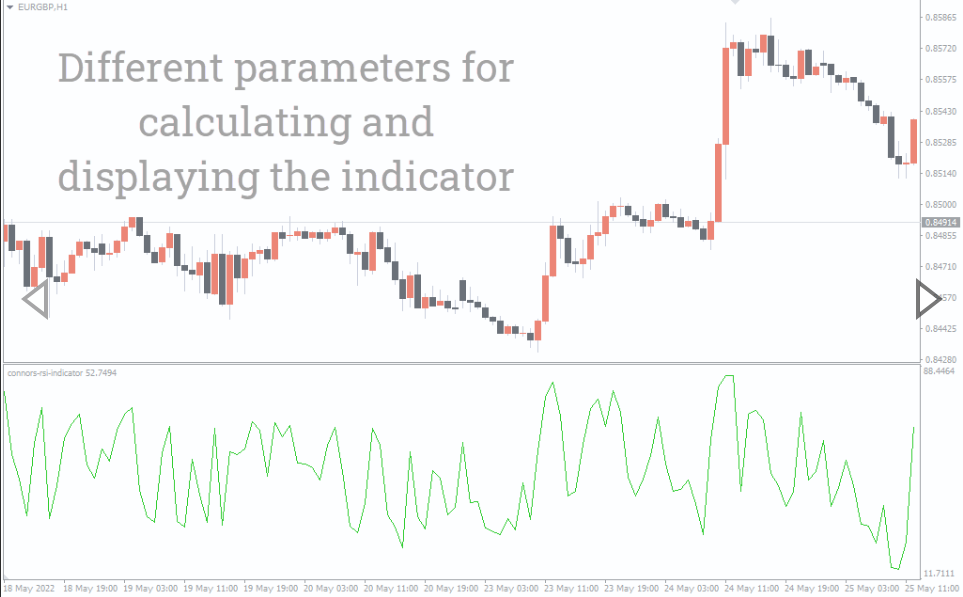
You can use the indicator on any time frame to trade any currency pair. The setting parameter allows you to add and tweak overbought and oversold areas.
How To Use The Connors Rsi To Identity Ideal Buy And Sell Signals
The indicator works like the typical RSI.
Buy Signal
When the indicators fall below 30, the currency pair is oversold. Therefore, it is likely to rally. You should look to enter long positions.
Sell Signals
The 90 reading indicates the currency pair is overbought, and buying pressure will likely wither out, leading to a pullback. You should therefore look to open short positions.
Connors Rsi Trading Example
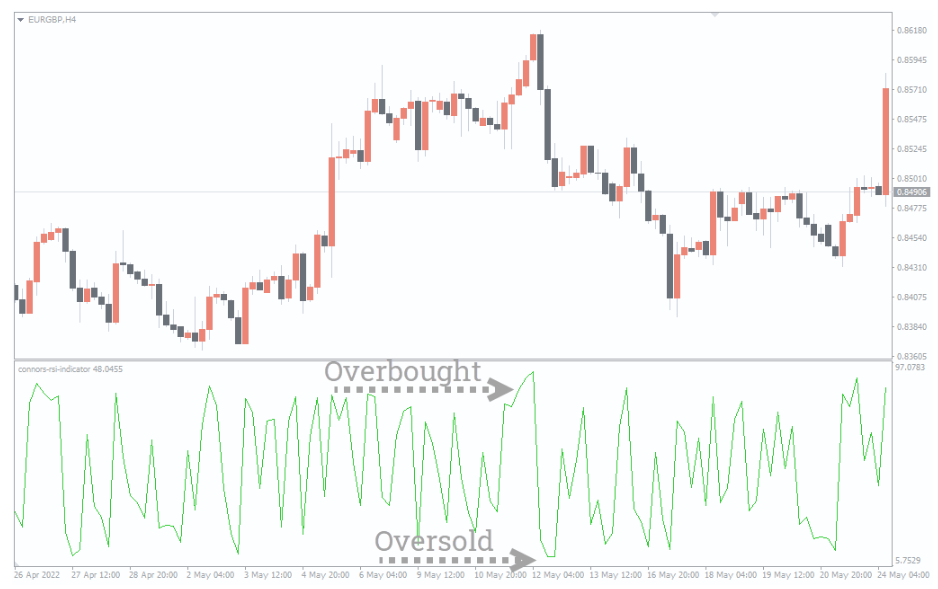
The chart shows the Euro against GBP chart for a 4-hour time. The price reverses strongly after entering the overbought area. This means buyers exited the market perhaps after hitting their targets. The price dropped massively.
After some time, the price entered an oversold area. The bears exited the market, causing a small rally.
Conclusion
Connors RSI is a modified RSI indicator that helps you identify overbought and oversold areas. It uses a shorter period to detect precise changes faster. The indicator works well when used in combination with other indicators.


Reviews
There are no reviews yet.