RVI Indicator
RVI Indicator For MT4 provides buy and sell forex trading signals, identifies bullish and bearish markets, detects divergence.
The RVI indicator for MT4 is a momentum indicator and measures the trend strength. The RVI (Relative Vigor Index) is similar to the classic RSI – Relative strength index indicator with a major difference in the calculation method. The indicator determines the bullish trend if the prices close higher than a predetermined period. Similarly, for a bearish trend, the price should close lower.
As the indicator determines bullish and bearish price trends and provides buy and sell forex trading signals based on the crossover of the indicator lines. The indicator is well suited for new and advanced traders. In fact, forex traders with experience using the RSI will find it easy to trade the RVI indicator. However, advanced forex traders can use the divergence of the indicator which acts as a leading indicator.
The indicator works well in all intraday price charts and the daily, weekly, and monthly price charts. However, in much lower time frames the indicator is prone to whipsaws. So, while using them traders should adjust the settings accordingly.
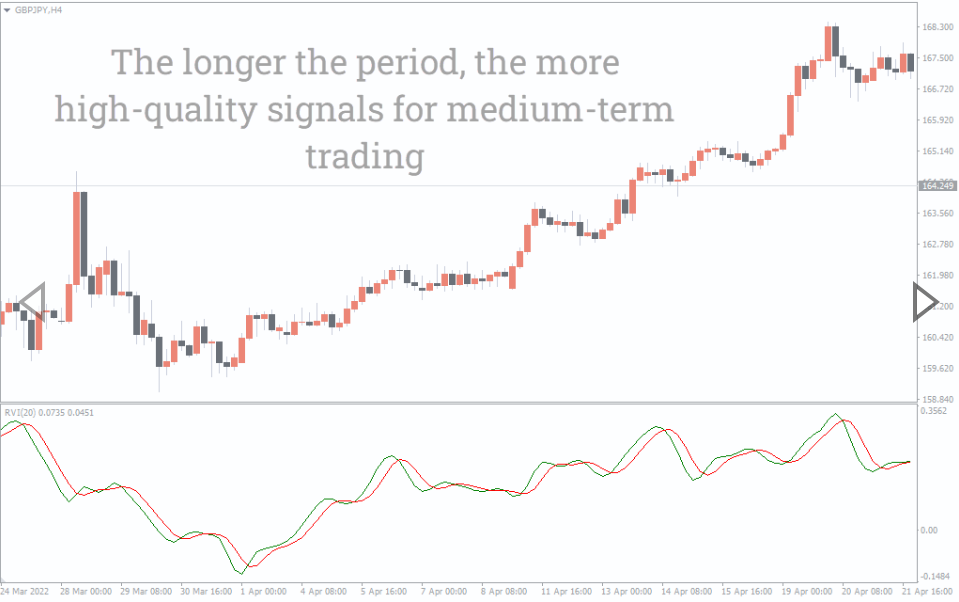
RVI Indicator For MT4 Trading Signals
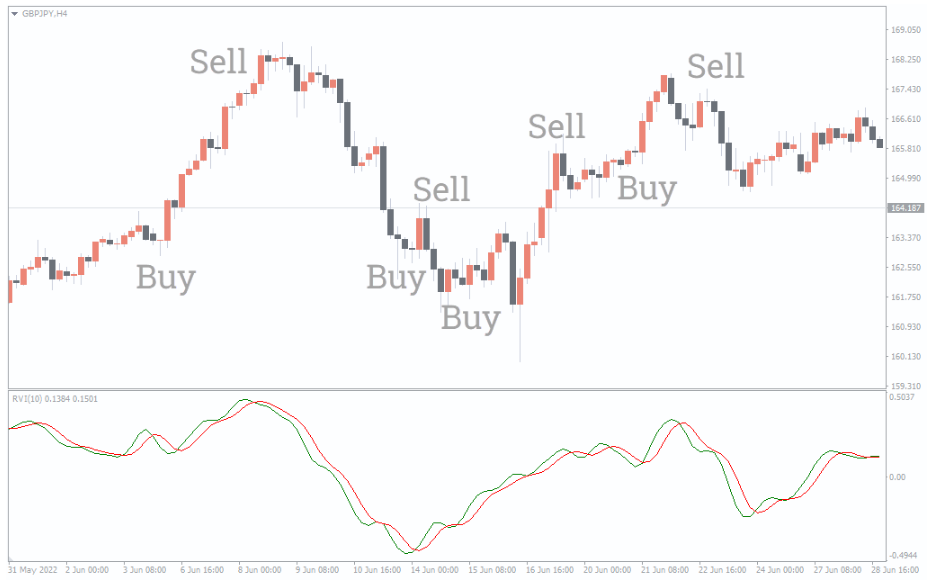
The above GBPJPY H4 candlestick price chart shows the RVI indicator for MT4 in action. The indicator plots the indicator line in red and the signal line in green.
Forex traders can apply various trading methods to the indicator. The first method is the crossover of the red line and the green line. If the green line crosses the red line upwards it indicates a bullish price trend. So, forex traders can enter the market with a buy trade adding a stop loss below the previous swing low. The indicator does not provide a profit target, so traders can exit the trade at the opposite trading signal. Similarly, in a bearish trend, the green line crosses the red line downwards. So, forex traders can place a sell trade with a stop loss above the previous swing high.
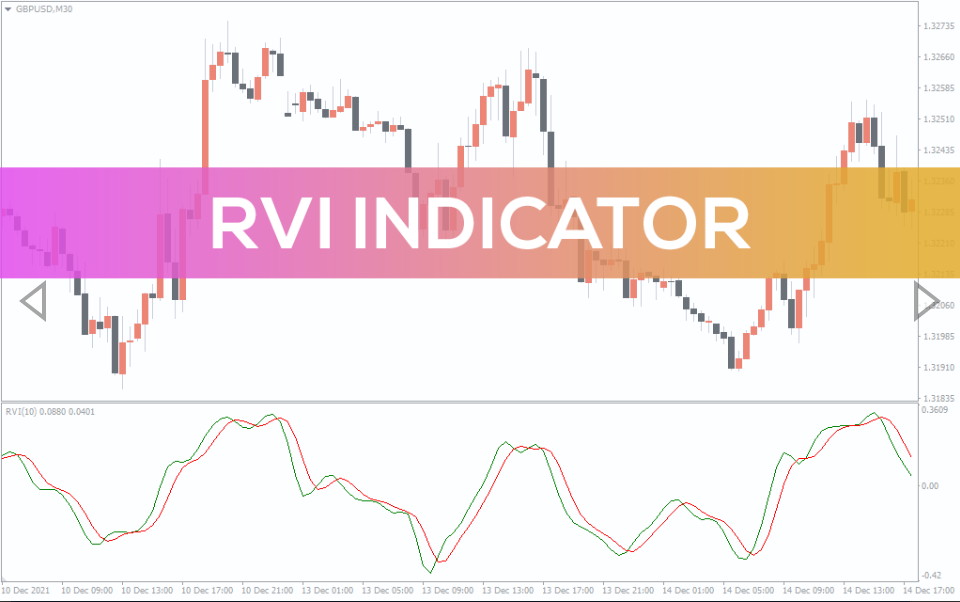
The next method involves the Zero line. The indicator line moves above the zero line in an uptrend and vice versa for a downtrend. So, forex traders can enter the market with a buy or sell trade accordingly. The next important trading method of the RVI indicator is using the divergence and convergence of the indicator line. This feature makes the RVI indicator a leading indicator and provides early trading signals of trend reversals.
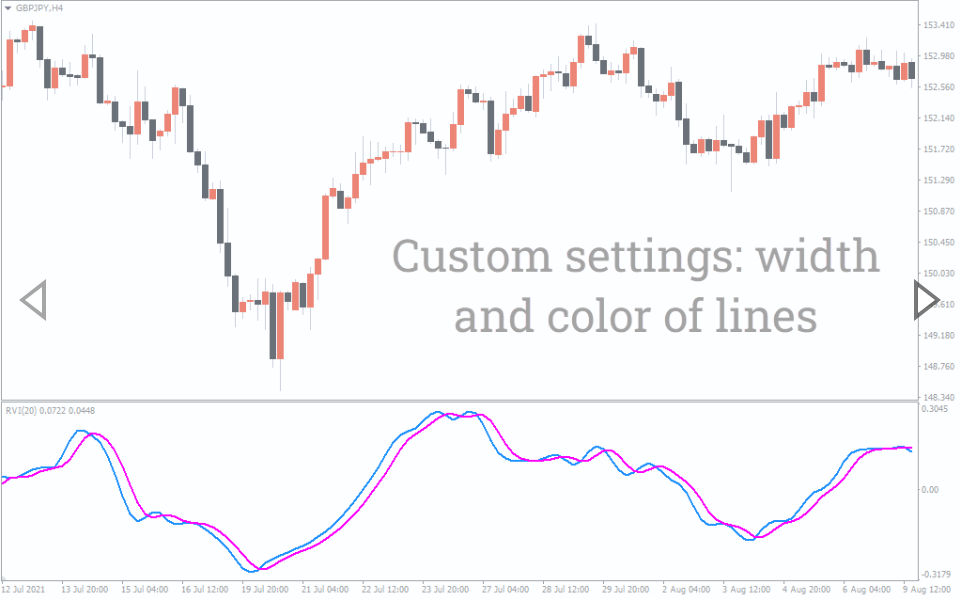
Furthermore, the slope of the RVI indicator line essentially indicates the increasing or decreasing momentum. So, forex traders can identify the strength or weakness of the current price trend using the slope of the indicator.
As a whole, the RVI indicator provides a complete overview of the market, while acting as a leading indicator while using divergence trading.
Conclusion
The RVI indicator for MT4 reflects the trend movements using a different calculation method than the RSI. Though both indicators provide bullish and bearish forex trading signals. Forex traders should spend time and understand the RVI better before buying and selling using the trading signals. Additionally, forex traders can download the indicator for free and install it easily.
You must be logged in to post a review.

Copyright 2025
Reviews
There are no reviews yet.