JX Parabolic Regression Stop and Reverse Indicator
Jx Parabolic Regression Stop And Reverse is a channel-based indicator that offers straightforward buy and entry points. It is an ideal detector of the trend direction.
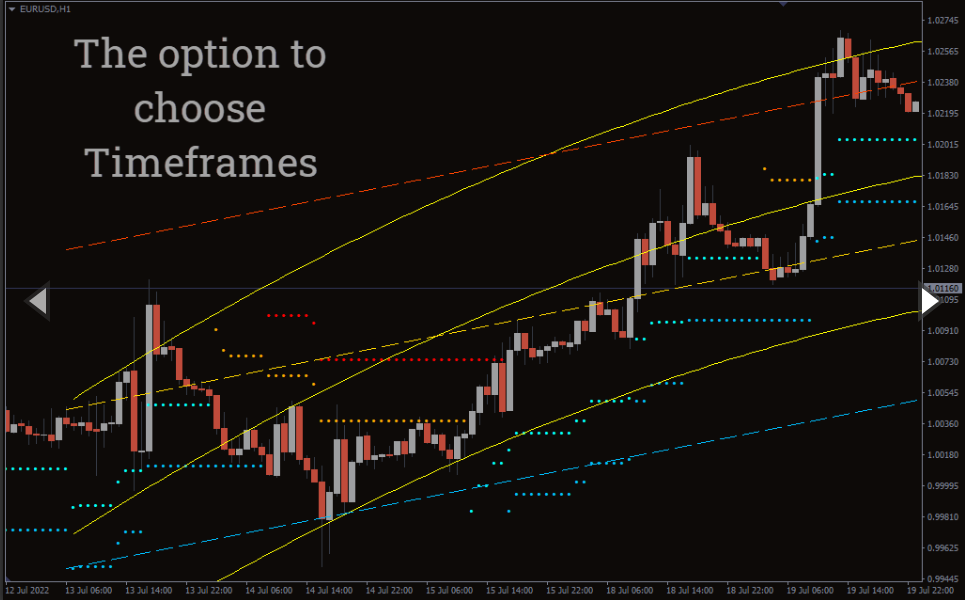
Jx parabolic regression stop and the reverse is one of the incredible technical tools that channel traders can use as a standalone indicator. It features two channels: a trendline channel and a dynamic regression channel. You can use the channel levels as entry and exit points. Therefore, it is suitable for both experienced and rookie traders and works well with all financial instruments and timeframes.
How JX Parabolic Regression Stop and Reverse Indicator Works
At the core of the indicator design is a trendline channel and curved regression channel. The trendline channel has a golden line that shows the current trend’s direction. The steeper the slope of this line, the solid the trend is.
If the regression line slants upwards but the price is below the line, it is a tell-tale sign of ending pullback. The price will shift to the upper side with trend continuation.
The channel has a red resistance line and a blue support line equidistant from the golden line.
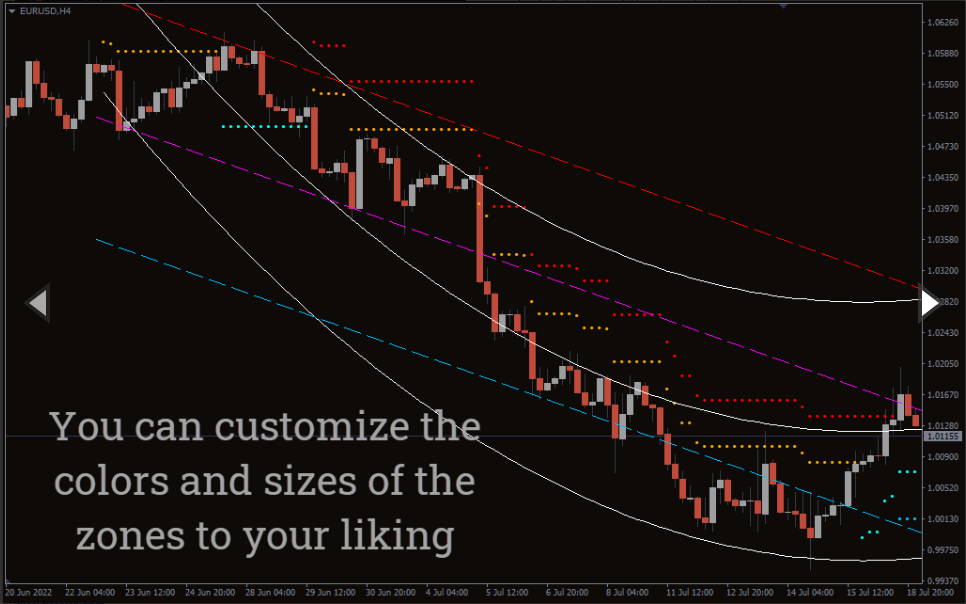
The indicator employs a special algorithm that uses a root mean square deviation and Fibonacci coefficient to calculate adaptive stop and stop reversal levels. These levels are indicated using blue or red dots.
The curved regressing channel also helps predict the future price by predicting support and resistance lines that change dynamically. During an uptrend, the channel bands have yellow lines, which change to green during a bearish momentum.
Buy Signal
Buy when the channel is slanting upwards. Wait for the price to fall to the channel’s resistance line (lower band). Once it forms a bullish pattern, you should be ready to enter a buy signal.
The indicator gives a strong buy signal when the non-linear channel breaks above the golden line in an upward slant. The signal is stronger the regression channel crosses the line from above.
Sell Signal
The indicator provides a sell signal when the indicator touches the upper band. The nonlinear channel should also cross below the golden line from above.
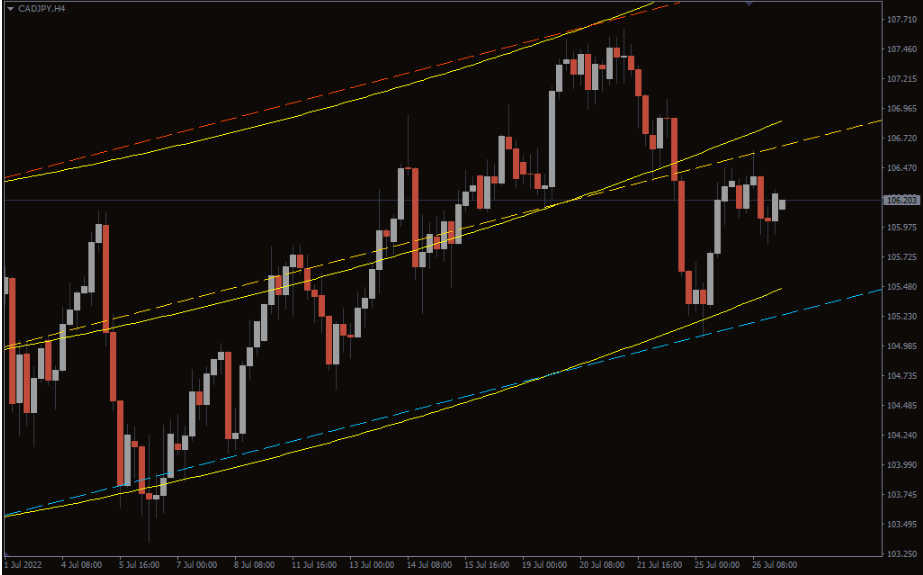
JX Parabolic Regression Stop and Reverse Trading Example
The chart shows price movements for the Canadian dollar against the Japanese yen. Notice how the price has hit support at the low band of the linear channel. Moreover, the curved regression channel has also crossed the golden middle line from below, another tell-tale sign of an uptrend. Moreover, all channels are slanting upward. This is a signal that the market is bullish. This is the right time to open a long position.
Conclusion
The Jx parabolic regression stop and reverse indicator is suitable for channel traders. It is designed with both linear and regression channels. That enables you to accurately detect the trend and ideal entry and support levels.
You must be logged in to post a review.

Copyright 2025

Reviews
There are no reviews yet.