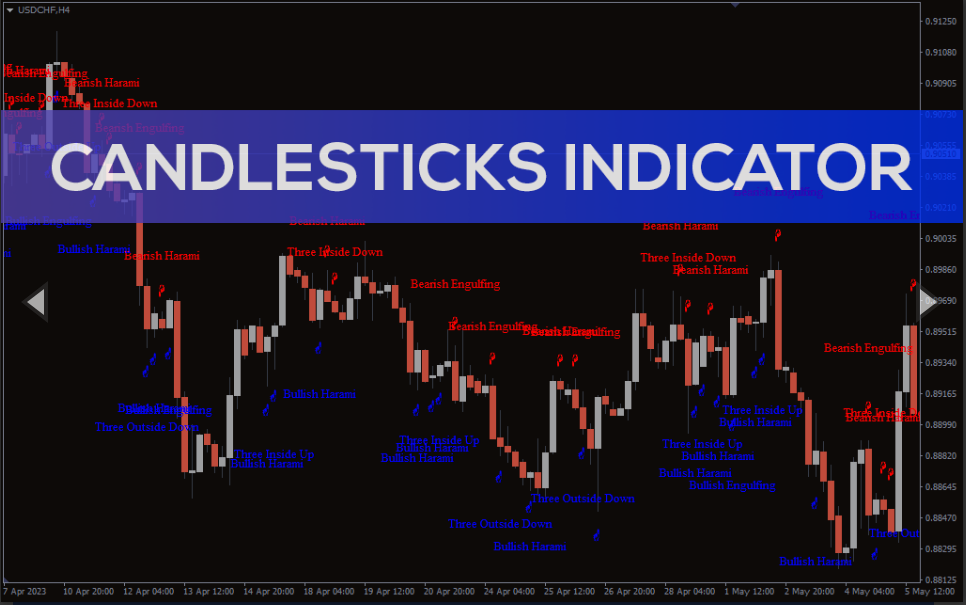
Candlesticks Indicator
Forex market patterns from the best Candlesticks Indicator for MT4. Find different candlestick patterns automatically.
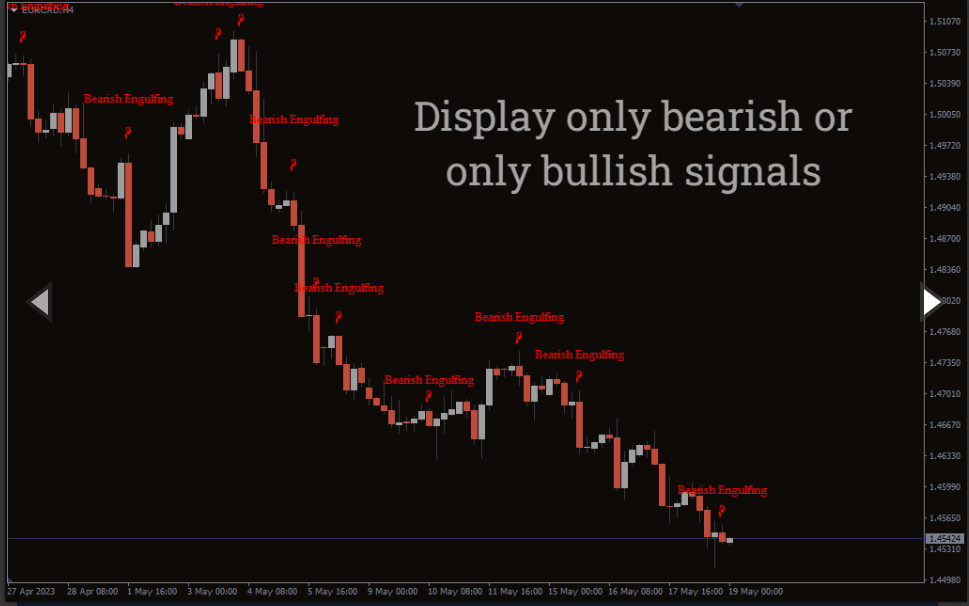
The Candlesticks Indicator draws multiple candlesticks patterns on the chart to determine the trend continuation and reversals.
These patterns include: bullish/bearish engulfing, three inside/outside down, dark cloud cover, three black crows, three outside/inside up, piercing line, three white soldiers, stars, and harami patterns.
How to Use the Candlesticks Indicator for MT4?
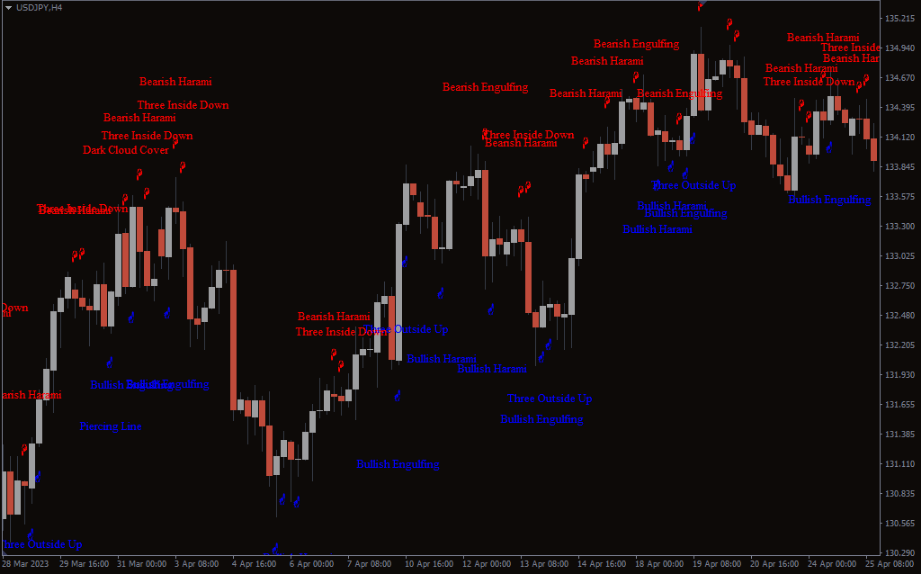
The above USD/JPY H4 chart shows the indicator on the chart. Here’s a description of all the types of patterns the indicator shows:
Bullish Engulfing Pattern: This pattern occurs when a small bearish candlestick is followed by a larger bullish candlestick that completely engulfs the previous candle’s range. It suggests a bullish reversal.
Bearish Engulfing Pattern: Similar to the bullish engulfing pattern, the bearish engulfing pattern indicates a bearish reversal. It consists of a small bullish candlestick and a larger bearish candlestick that engulfs the previous candle.
Dark Cloud Cover: The dark cloud cover pattern appears when a bullish candlestick is followed by a bearish candlestick that opens above the previous close but closes below the halfway point of the previous candle’s body. It indicates a potential reversal or a halt in the current upward trend.
Three Black Crows: This pattern consists of three long, bearish candlesticks, each closing near the day’s low. It indicates a strong bearish sentiment and the potential continuation of a downtrend.
Three Outside/Inside Up Pattern: This pattern occurs when three consecutive candlesticks, either bullish or bearish, close higher than the previous candle’s high (outside up) or lower than the previous candle’s low (inside up). It suggests a reversal.
Three Inside/Outside Down Pattern: This pattern occurs when three consecutive candlesticks are contained within the previous bullish/bearish candles range. It suggests a reversal.
Piercing Line: The piercing line pattern consists of a bearish candlestick followed by a bullish candlestick that opens below the previous close but closes above the halfway point of the previous candle’s body. It indicates a reversal or a pause in the current downtrend.
Three White Soldiers: This pattern is the opposite of the three black crows pattern. It consists of three consecutive long bullish candlesticks, each closing near the day’s high. It indicates a strong bullish sentiment and the potential continuation of an uptrend.
Stars: A star pattern forms when a small candlestick gaps away from the preceding large candlestick. It suggests indecision in the market and potential trend reversal.
Harami: It occurs when a small candlestick with a narrow range is contained within the body of the previous larger candlestick. They indicate a potential reversal of the current trend.
Conclusion
The Candlesticks Indicator for MT4 shows multiple candlestick patterns on the chart. By looking at these patterns, you can find trend continuation and a reversal.
You must be logged in to post a review.

Copyright 2025
Reviews
There are no reviews yet.