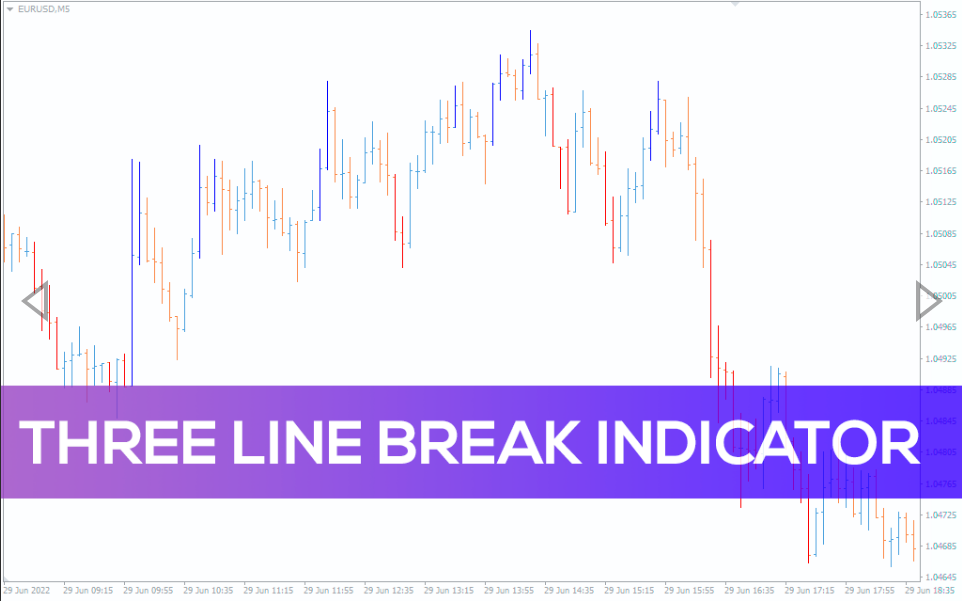
Three Line Break is a suitable indicator for identifying trend reversal.
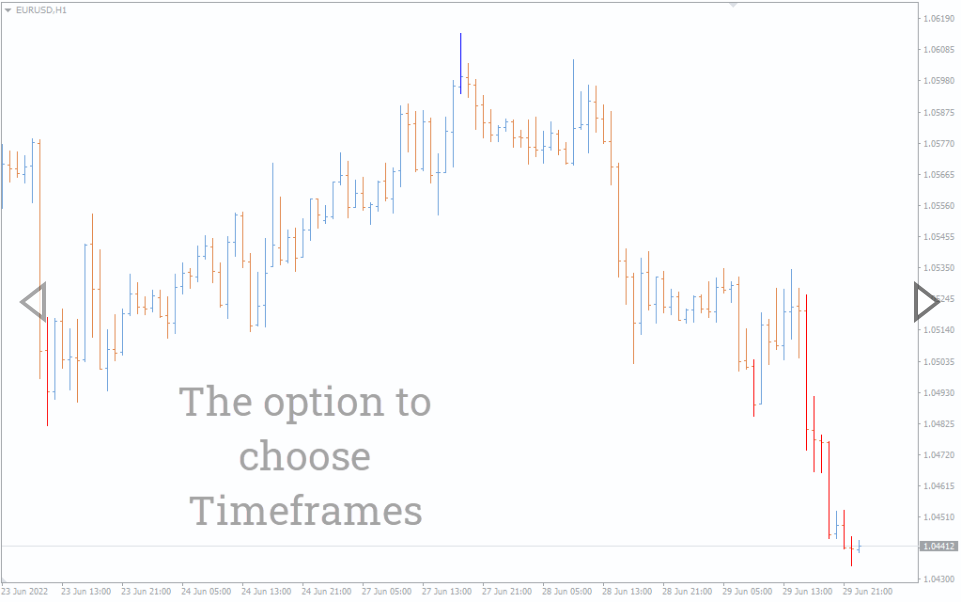
The Three Line Break introduces a new method of plotting a price chart. It is one of the Japanese charts that use the closing price to form “lines’ ‘ which are different from the candlesticks. Essentially, it only plots significant price movements rather than the whole price action. It eliminates the time factor and might appear different from the conventional chart. You can use the indicator to trade to plot long-term and short-term strategies of any instrument.
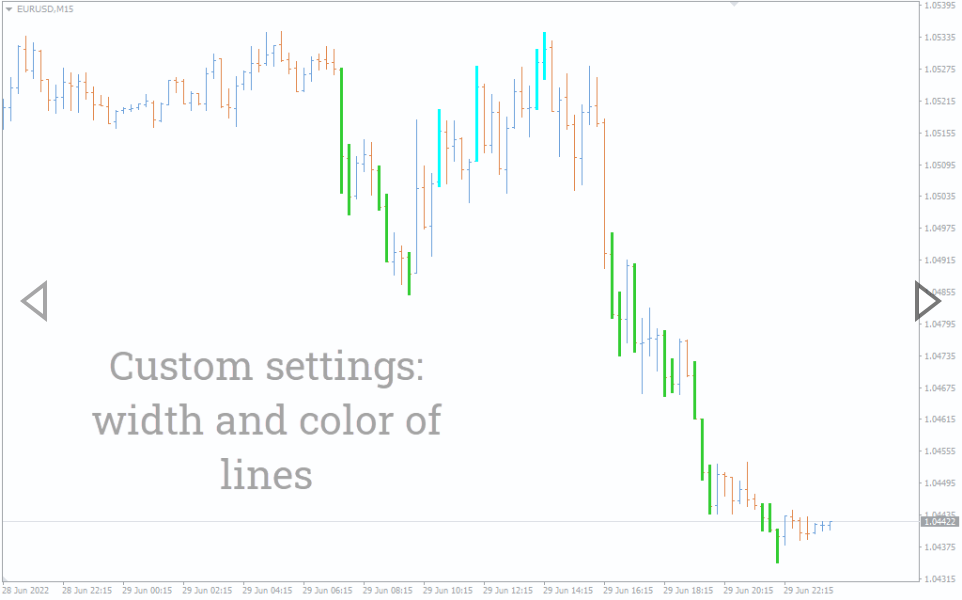
But you don’t have to track all the three line break formations. The indicators do all the job and post them for you.
How to Use the Three Line Break Indicator
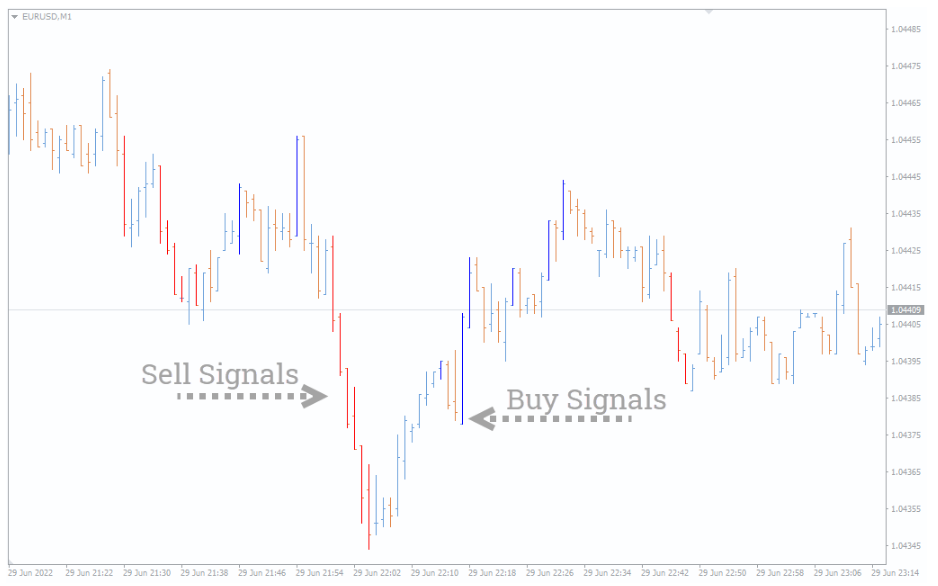
How to Buy
During an uptrend, you want to wait for the three bearish lines to form after an uptrend. Enter the trend when a bullish line breaks the three lines.
How to Sell
Wait for three bullish lines to appear during a bearish trend. Enter a short position when a bearish line forms after the three bullish lines.
Three Line Break Real Market Trading
The price action shows the movement of the Euro against the New Zealand dollar currency pair on a daily time frame. The indicator posts a sell signal during a downtrend.
Similarly, buy when the indicator posts a buy signal and exit when the indicator posts a bearish reversal signal.
Conclusion
Three line break is an excellent indicator for identifying sell and buy signals using a three-line break strategy. It involves three lines that form as a pullback during a downtrend or uptrend. You only have to look at the indicator and enter a buy when the indicator shows a bullish signal and vice versa.
Reviews
There are no reviews yet.
Be the first to review “Three Line Break Indicator” Cancel reply
We use cookies to ensure that we give you the best experience on our website. If you continue to use this site we will assume that you are happy with it.Accept


Reviews
There are no reviews yet.