Nice Value Chart Indicator
The super nice oscillator. It automatically detects overbought and oversold zones! Compatible with all markets and timeframes. It doesn’t repaint. Contains alerts.
The Nice Value Chart Indicator is another technical oscillator designed to automatically detect overbought and oversold zones.
Compared to other oscillators, the Nice Value Chart Indicator has one distinctive feature – it is super pleasant to look at.
How do I add a Nice Value Chart indicator to the main chart in MT4?
First of all, download for free “Nice Value Chart 1.0.ex4” from our website. Then paste it to the Metatrader 4 by following these instructions.
To add an indicator to the chart, use one of 2 ways:
drag and drop the indicator from the Navigator window to the open price chart;
select Insert / Indicators / Custom / Nice Value Chart from the main menu.
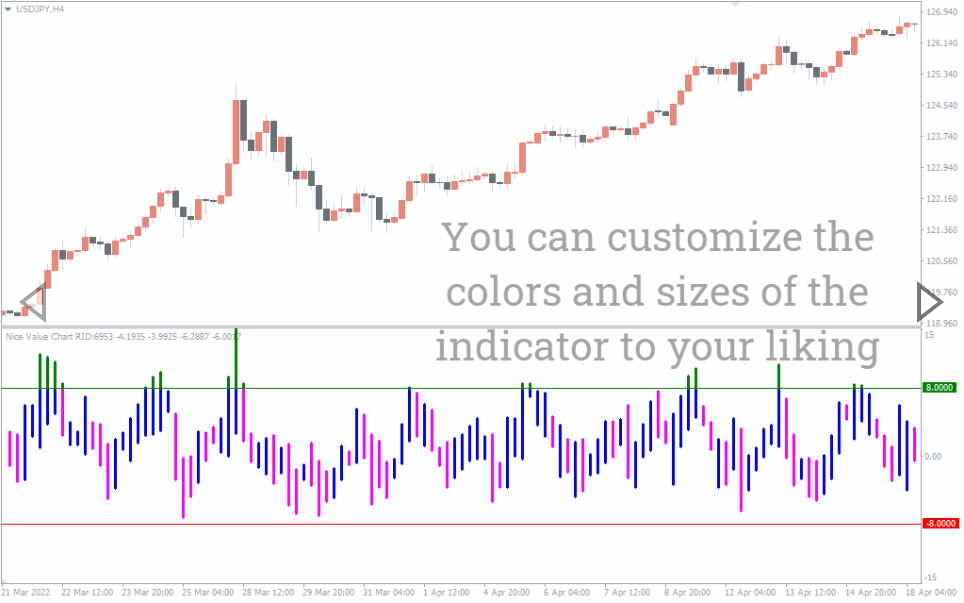
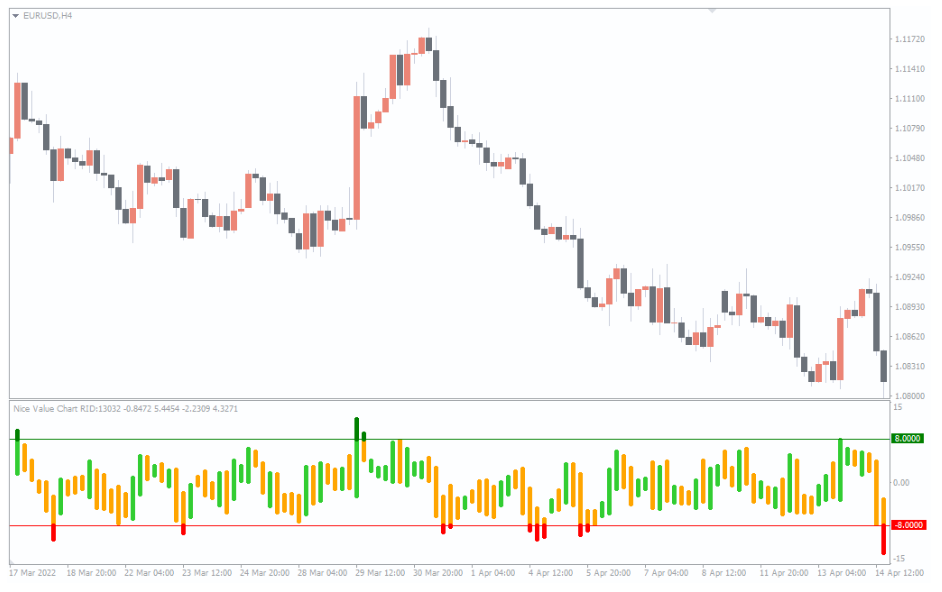
By adding the indicator to the chart, you will see under the price area:
nice four-color vertical bars, the values of which are calculated on the basis of price dynamics;
two lines defining the boundaries of overbought and oversold.
How to use the Nice Value Chart for trading
Usually the Nice Value Chart Indicator values fluctuate around zero.
When the value rises above the overbought line (the indicator’s bar changes color to green) – it gives a basic sell signal on the basis that the price is too high and should go lower.
Similarly, the opposite is true – if the indicator value falls below the oversold line – it gives a basic buy signal. At the same time, the indicator’s bar changes its color to red. By opening a long position based on this signal, the forex trader makes the assumption that the asset is too cheap and should rise in price.
How accurate are the base signals?
Nice Value Chart Indicator has a common problem:
The sell signal can mean that the market is entering (or has already entered) a bullish trend. And expectation of the bearish reversal may not be justified, and bring losses.
Similarly, the opposite is true. A buy signal from an oversold zone can result in a loss if the market is entering (or has entered) a bearish trend.
To struggle with this problem, it is recommended to use additional methods of chart analysis – for example, graphical patterns, support and resistance levels and/or other indicators as filters.
This should increase the chances that trades on the basic signals of the Nice Value Chart Indicator will bring profits rather than losses.
The examples below will give more clarity.
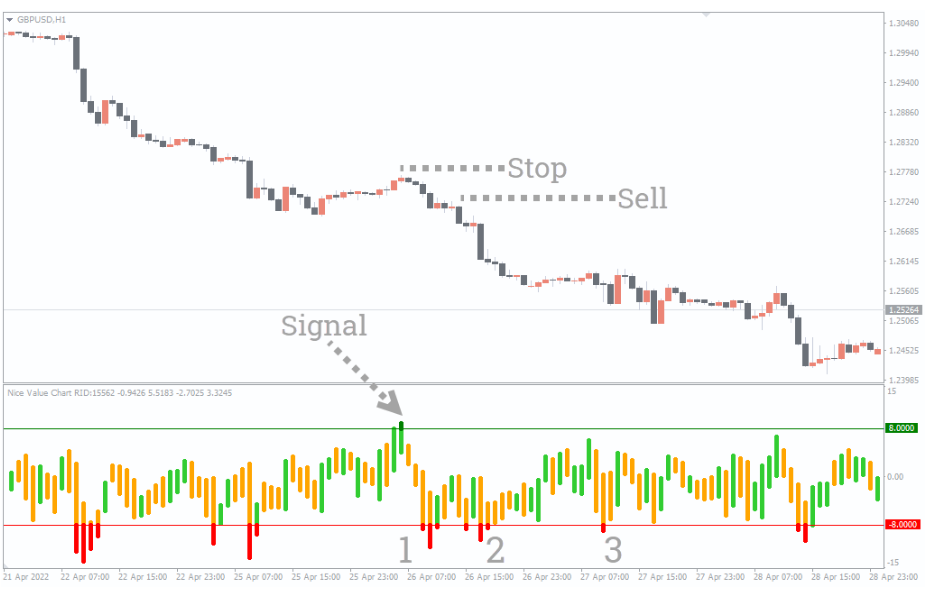
Nice Value Chart Sell Signals
As an example in the chart below (forex market GBPUSD, 1h), the signal to sell comes when:
Market is in a bearish trend.
The oscillator enters an overbought
In this case, enter the short position when the price reverses downwards (for example, falling below the low of the previous bar). A stop-loss can be set just above the bar at which the indicator gave the overbought signal.
If the market resumes a bearish trend, the indicator will periodically enter oversold territory – use this indication (shown with numbers 1, 2 and 3) as a signal to trail your stop-loss lower to protect rising profits.
Exit a position when the desired profit is reached or the market signals that the trend is over. Choose the risk management method that best suits your personal preference.
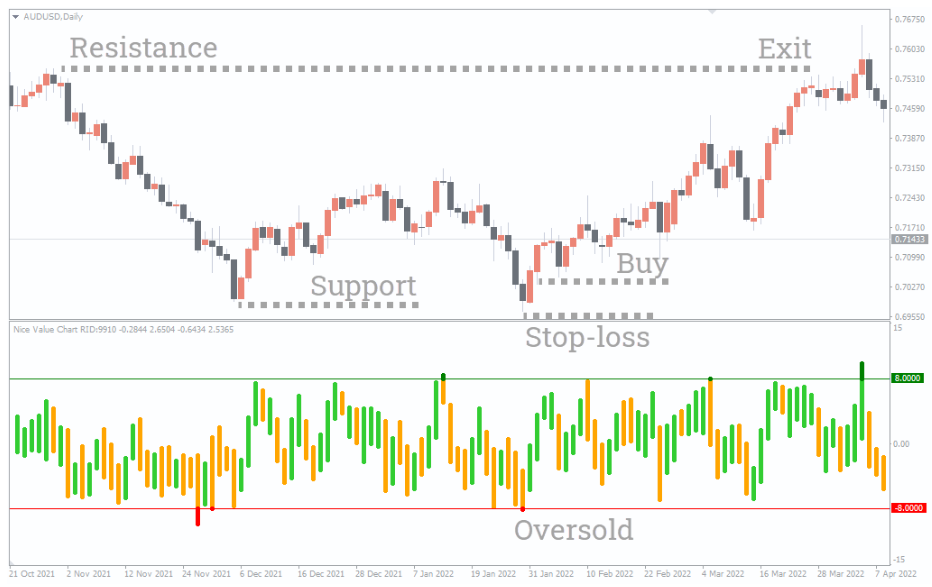
Nice Value Chart Buy Signal
The signal to buy comes when:
The price is near the support level.
Nice Value Chart Indicator falls below the oversold
The example above (forex market AUDUSD, Daily chart) shows a buy signal that meets the conditions described. Find a more precise entry point to the long position can be found on the lower timeframe.
Also you can put a protective stop-loss below the bar, at which the oversold condition was detected.
You can exit the position with a profit when receiving a counter signal around resistance (as shown on the chart), or using:
trailing stop-stop;
fixed take-profit.
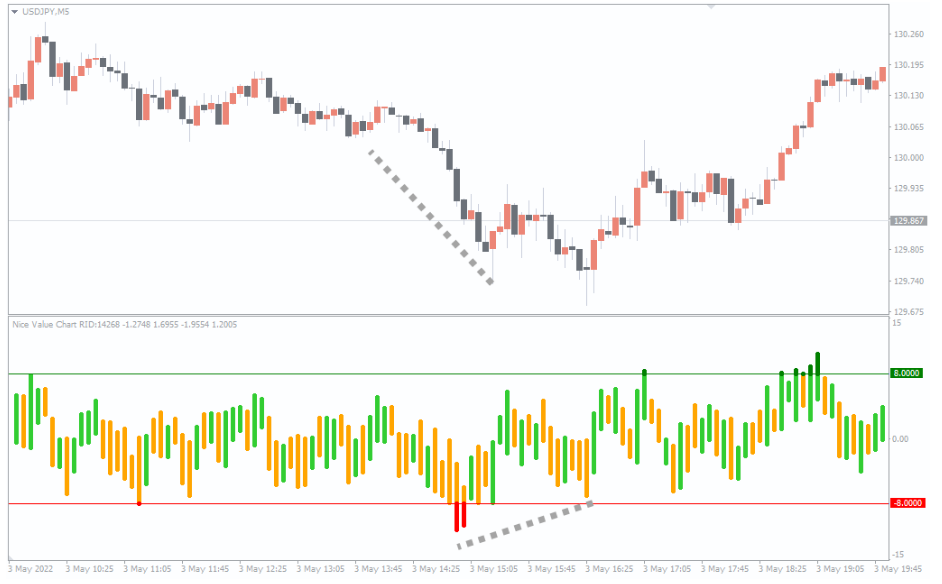
Additional Signal
Divergences are another way to use the Nice Value Chart indicator.
The chart above (forex, USDJPY 5m) shows a situation in which the rising lows in the indicator correspond to the falling lows in the price. This bullish divergence provides a warning that the bearish trend is exhausting and traders should be prepared for a reversal.
Conclusion
The Nice Value Chart Indicator for Metatrader helps you buy on the lows and sell on the highs. The indicator automatically tracks the moments when the price goes into overbought and oversold zones.
Advantages of the indicator:
You can set up alerts to not miss buy and sell signals.
Non-repaint.
High quality design.
Simple settings.
It sends alerts automatically as soon as signals
It is applicable for intraday trading as well as for opening investment positions on daily/weekly/monthly charts.
It is applicable to any markets: forex, stocks and others.
Disadvantages of the indicator:
No arrows.
Exact formula by which the indicator is calculated is unknown.
Buy and sell signals are of low.
We recommend that you take measures to improve the reliability of the indicator signals. For example, give preference to:
buy signals during a bullish trend;
sell signals during a bearish trend.
Download Nice Value Chart Indicator for MT4 indicator for Free Now!
You must be logged in to post a review.

Copyright 2025


Reviews
There are no reviews yet.