Camarilla Pivot Points Indicator
Forex BUY and SELL signals from the best Camarilla Pivot Points Indicator. Find out support and resistance levels.
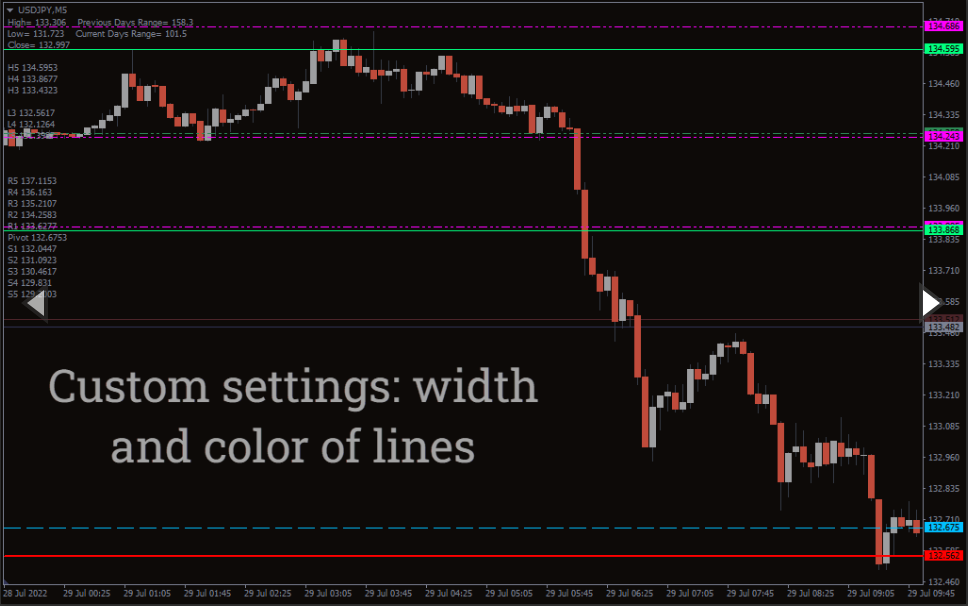
The Camarilla Pivot Points Indicator is a simple MT4 indicator that tells about the support and resistance levels. The traditional Camarilla Pivot Points is a math-based indicator that uses the previous day’s high, low, and closing price to create support and resistance lines on the chart. Nick Scott created it.
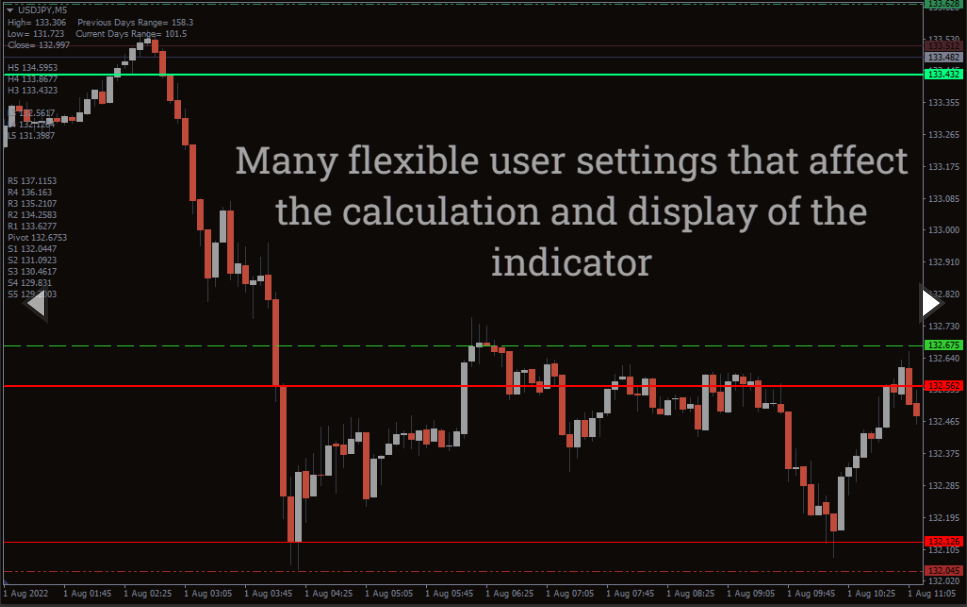
The Indicator takes calculations from the traditional indicator and applies them. However, it creates more support and resistance lines. There are a total of 17 lines that use Fibonacci numbers. If the price goes above the top resistance line, it’s a strong downtrend, while if it goes below the low support line, it’s a strong uptrend.
It’s better to apply the indicator on longer timeframes, as it is prone to false signals on lower ones.
Camarilla Pivot Points Indicator BUY/SELL signals
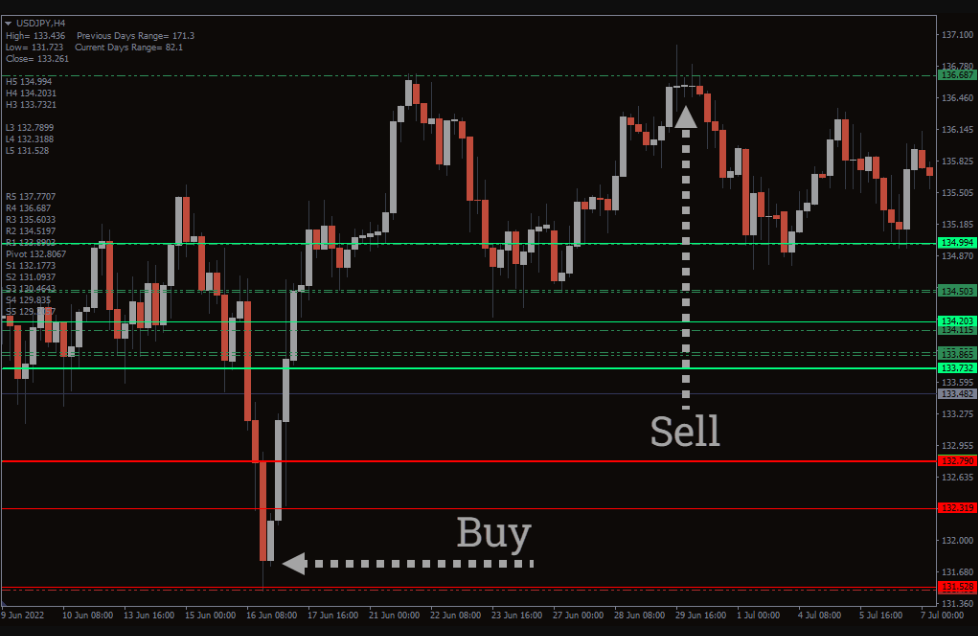
The above USD/JPY H4 chart shows the BUY and SELL signals with the indicator. To determine the BUY and SELL signals, traders need to locate the lower and higher lines. The lower line reflects the support, and traders can enter long, while the higher line marks the resistance level, and here traders can enter short.
You can also enter at the center lines, but it’s best to wait for the price action to fully develop and then take positions. If you want further signal confirmation, you can use other indicators like the RSI or MACD along with these Indicator.
Conclusion
The Camarilla Pivot Points Indicator uses Fib numbers to draw levels of support and resistance. Besides, you can download the indicator for free on our website.


Reviews
There are no reviews yet.