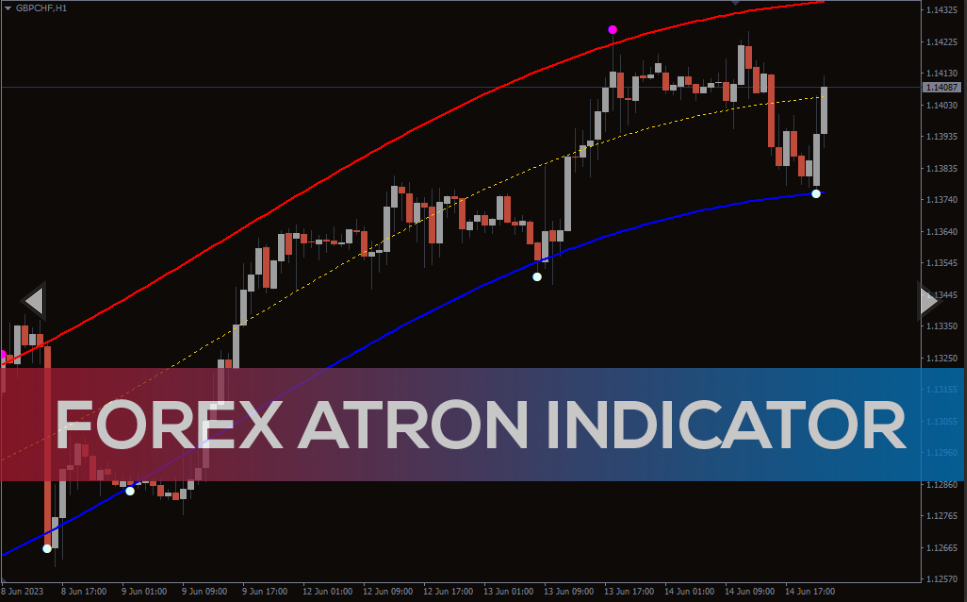
Forex Atron Indicator finds the overbought and oversold levels and identifies market reversals.
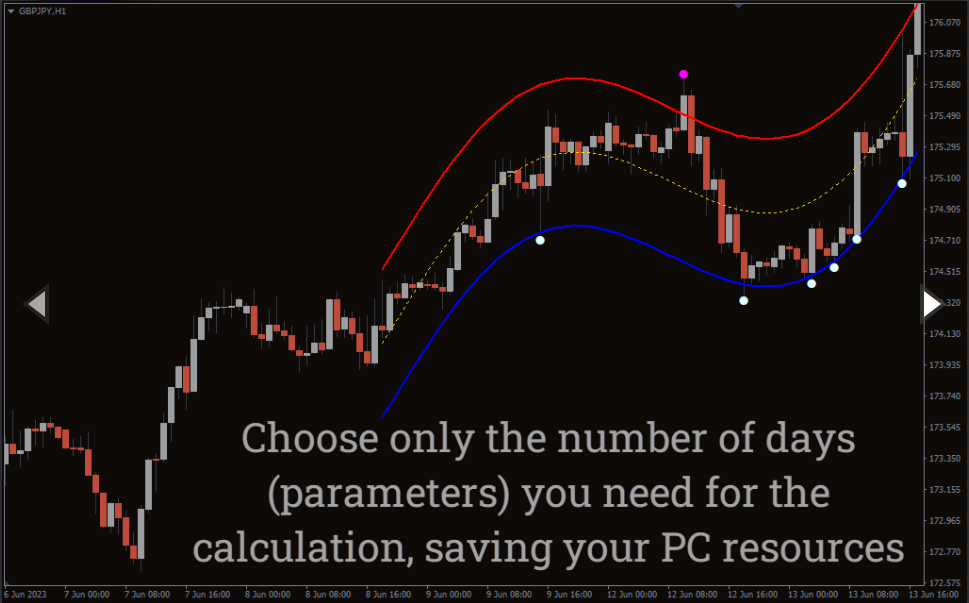
The Forex Atron Indicator highlights price volatility and potential trend reversals by creating three bands on the chart. It uses standard deviation to generate these bands.
The upper band is depicted in red and signifies higher price volatility. The middle band, shown as a dotted yellow line, represents the mean or average price over a specified period. Finally, the lower band, indicated by the color blue, represents a lower level of price volatility.
How to use the Forex Atron Indicator for MT4?
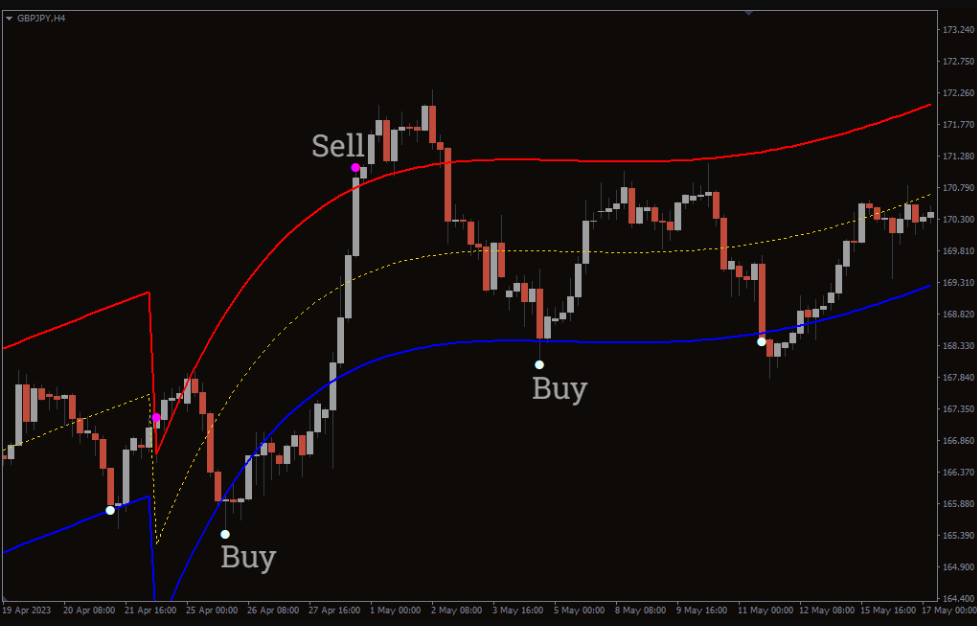
The above GBP/JPY H4 chart shows the BUY/SELL signals of the indicator. You can look for a bullish signal for a BUY strategy when the price approaches or touches the lower blue band.
Conversely, you can watch for a bearish signal for a SELL strategy when the price approaches or touches the upper red band.
It’s important to note that the Forex Atron Indicator should be used with other technical analysis tools and indicators.
Conclusion
The Forex Atron Indicator for MT4, with its three bands based on standard deviation, provides traders with a visual representation of price volatility. You can enter the trade when the price approaches the lower or the upper band.
Reviews
There are no reviews yet.
Be the first to review “Forex Atron Indicator” Cancel reply
We use cookies to ensure that we give you the best experience on our website. If you continue to use this site we will assume that you are happy with it.Accept

Reviews
There are no reviews yet.