KAMA Indicator
KAMA indicator for MT4 provides forex trading signals using Kaufman’s Adaptive MA and identifies flat and trending markets.
The KAMA indicator for MT4 is a dynamic moving average indicator that changes character based on market trends. The KAMA is the abbreviation for Kaufman’s Adaptive Moving Average developed by Perry Kaufman. Generally, moving averages are lagging indicators. But the indicator hugs the prices and plots too tight to the price if the market movement is slow. On the other hand, the KAMA distances itself from the price of a trending market. Thus, allowing enough gap between the price and indicator line during volatile price movements. So, forex traders can understand the trending and ranging nature of the market and buy and sell accordingly.
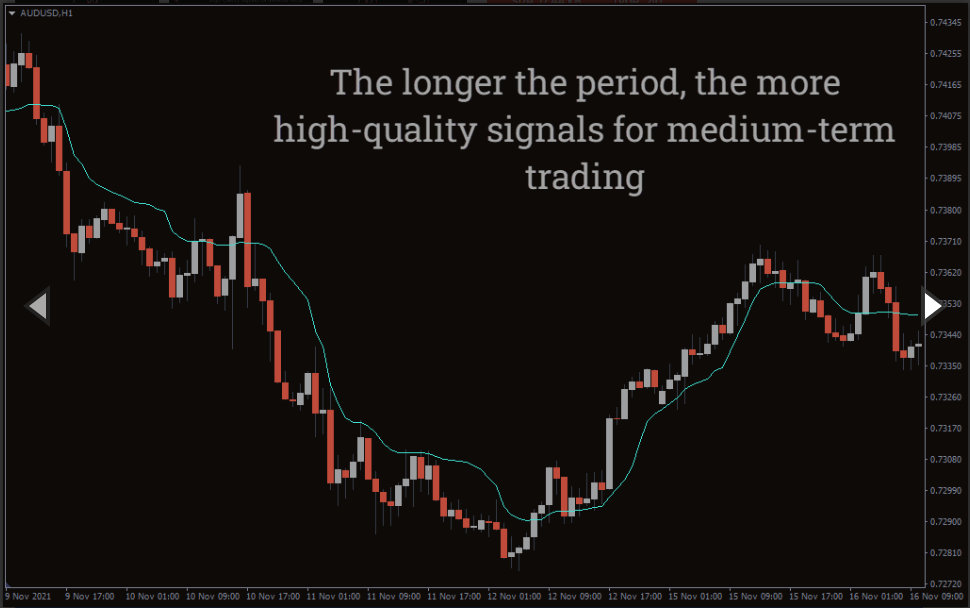
The indicator is suitable for new and advanced forex traders. New forex traders can easily identify the trending and flat nature of the market and prepare trading strategies accordingly. However, advanced forex traders can apply multiple trading strategies using this indicator. The indicator works well on intraday price charts and daily, weekly, and monthly price charts. So, forex traders can use the indicator for identifying the higher time frame market trend and use it for top-down technical analysis. Furthermore, the indicator is available as a free download and is easy to install.
KAMA Indicator For MT4 Trading Signals
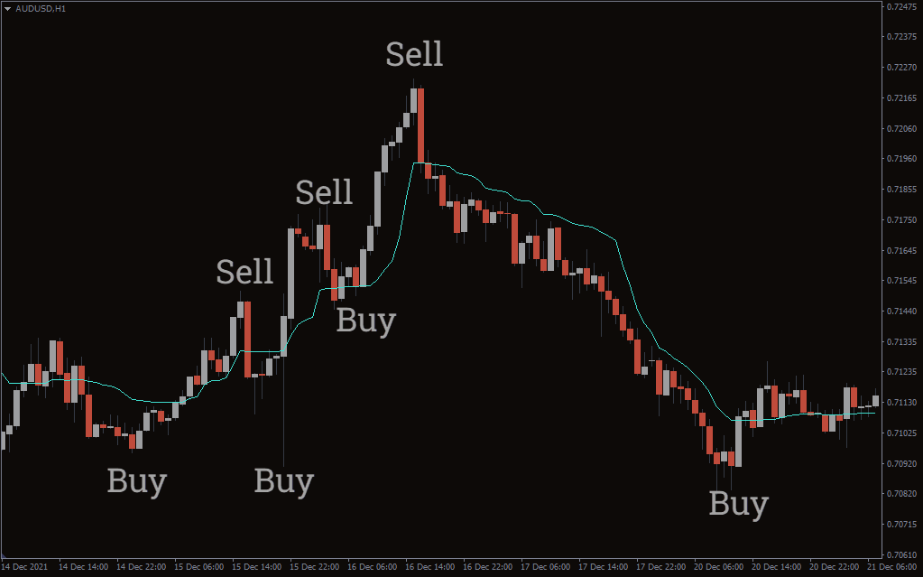
The above AUDUSD H1 candlestick price chart shows the KAMA indicator for MT4 in action. The indicator plots the KAMA line on the chart as blue. Forex traders can apply an indicator line and price cross-over trading strategy. Additionally, traders can employ multiple indicators cross-over using a slow and fast KAMA. However, the latter is not preferred as it provides delayed trading signals.
If the price is flat or in a tight range the KAMA indicator line stays flat. So, forex traders should stay away from the markets and abstain from trading during this period. If the price crosses the KAMA indicator line and closes upward, it indicates a potential bullish market. So, forex traders should enter the market with a buy position with a stop loss below the previous swing low. Moreover, the indicator does not provide a profit target so traders should look to exit with a good risk reward ratio.
Similarly, if the price closes below the KAMA indicator line, it indicates a potential bearish price trend. A sell trade is warranted with a stop loss above the previous swing high. The direction of the KAMA indicator shows the potential market trend direction. A KAMA line pointed upwards signals a bullish market condition, while a downward pointed KAMA signals a bearish market condition. Forex traders can use this to identify the major trend and place trades in this direction and ignore trading signals in the opposite direction.
Conclusion
The KAMA indicator for MT4 or Kaufman’s adaptive moving average is one of the answers to make the moving averages more responsive and adaptive to market volatility. Though the indicator is simple to use, the indicator tends to provide false trading signals as it overlaps the price bit aggressively. So, forex traders should use additional tools like price action to confirm the trading signals.
You must be logged in to post a review.

Copyright 2025


Reviews
There are no reviews yet.