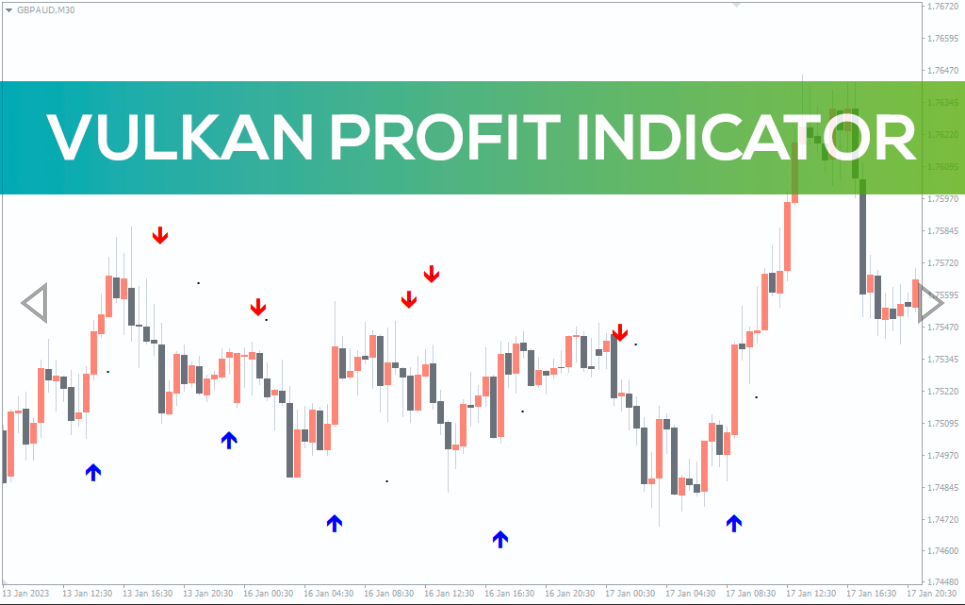
Vulkan Profit Indicator
Forex simple trend signals from the best Vulkan Profit Indicator for MT4. Find the trend’s direction with the arrows.
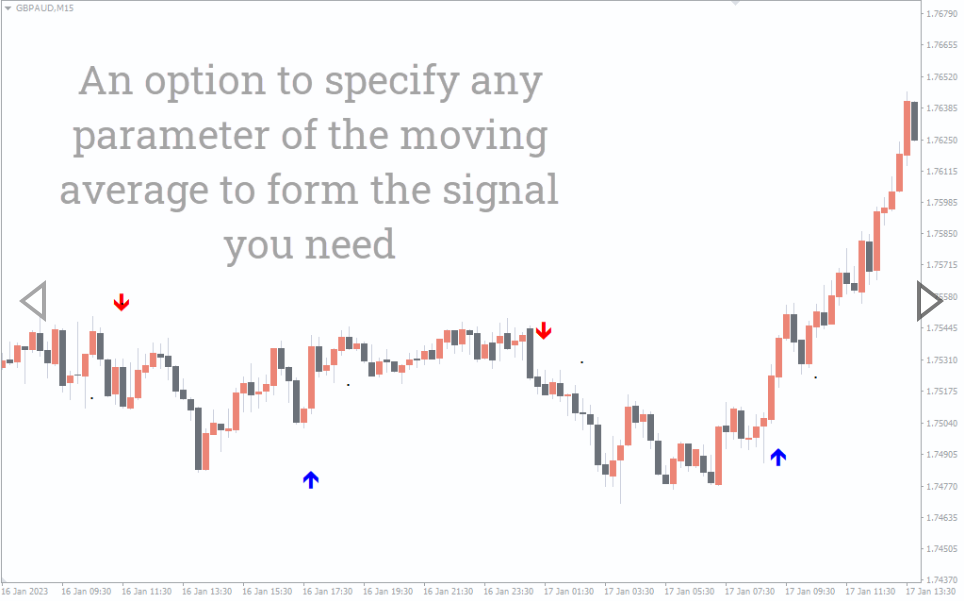
The Vulkan Profit Indicator is a simple MT4 indicator that draws blue and red arrows to tell the direction of the trend. The indicator uses the VWMA (volume-weighted moving average) and the fast and slow EMAs to plot these arrows.
By navigating the arrows, you can find the direction of the trend. The indicator also plots black dots. These dots signify trend continuation and a reversal.
You can use the Vulkan Profit Indicator on any timeframe; however, on lower timeframes, it is prone to false signals.
How to use the Vulkan Profit Indicator for MT4?
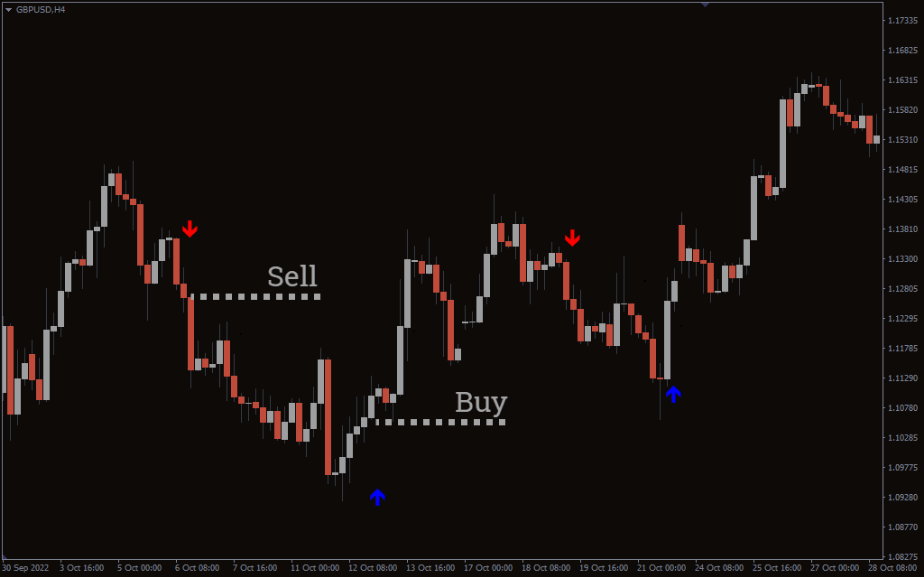
The above GBP/USD H4 chart shows the BUY and SELL signals with the Vulkan Profit Indicator.
Whenever the indicator plots the blue arrow, it’s a long entry point. Conversely, if there is a red arrow, you can go short.
As mentioned earlier, the indicator also plots black dots. Taking note of these dots is super important. If the dots appear right after the formation of the arrow, then it’s a continuation signal, while if it appears after some time, there is a possibility of a trend reversal.
Conclusion
The Vulkan Profit Indicator for MT4 simply plots the red and blue arrows to signify the trend’s direction. It also illustrates black dots for trend reversal and continuation.
If you want to try the indicator, you can download the indicator for free on our website.

Reviews
There are no reviews yet.