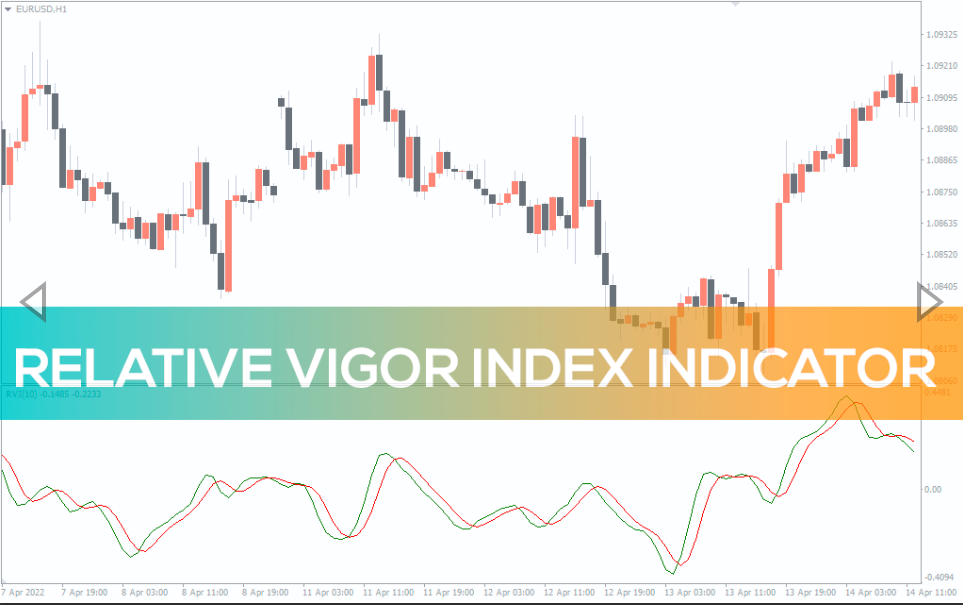
Relative Vigor Index Indicator
The Relative Vigor Index (RVI) is a technical indicator used to identify overbought and oversold conditions in the market.
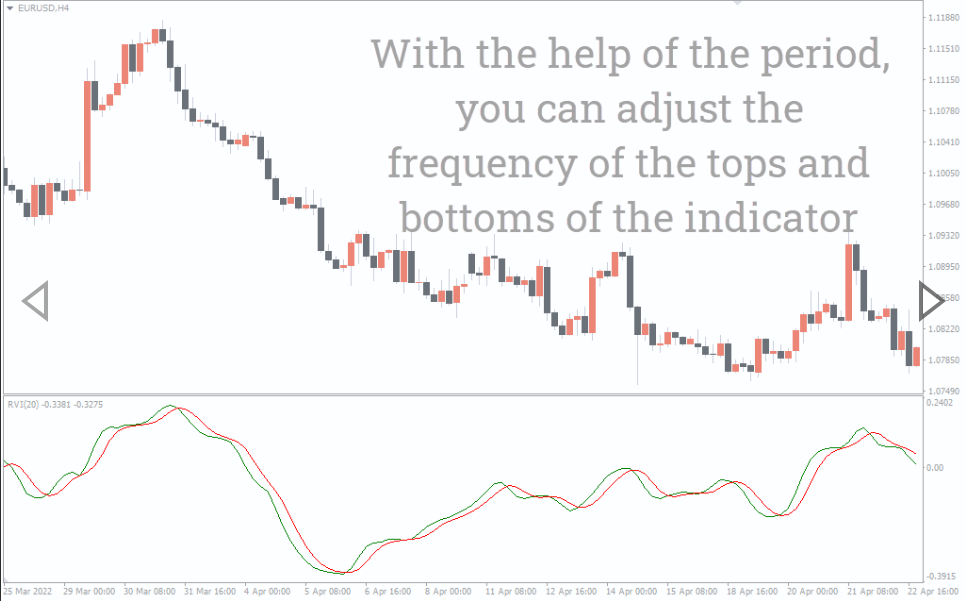
The Relative Vigor Index (RVI) is a technical indicator that measures the strength of a trend. It is based on the assumption that the longer a trend has been in place, the harder it is to reverse.
As such, the RVI can be used to identify potential turning points in the market. The indicator consists of two lines: a main line and a signal line. The main line is calculated by taking the difference between the closing price and the moving average of the closing price, while the signal line is a moving average of the main line.
The RVI is considered to be bullish when the main line is above the signal line and bearish when it is below. A reading of 50 indicates that there is no trend in place. The Relative Vigor Index can be used in conjunction with other technical indicators to generate trading signals. It is most commonly used in forex trading but can also be applied to other markets.
Relative Vigor Index BUY / SELL Signals
The Relative Vigor Index (RVI) technical indicator is used as a complement to other technical indicators or can be used as a stand-alone forex trading strategy. The RVI is displayed as a line that oscillates between values of 0 and 100.
There are three main signal types that traders look for when using the RVI:
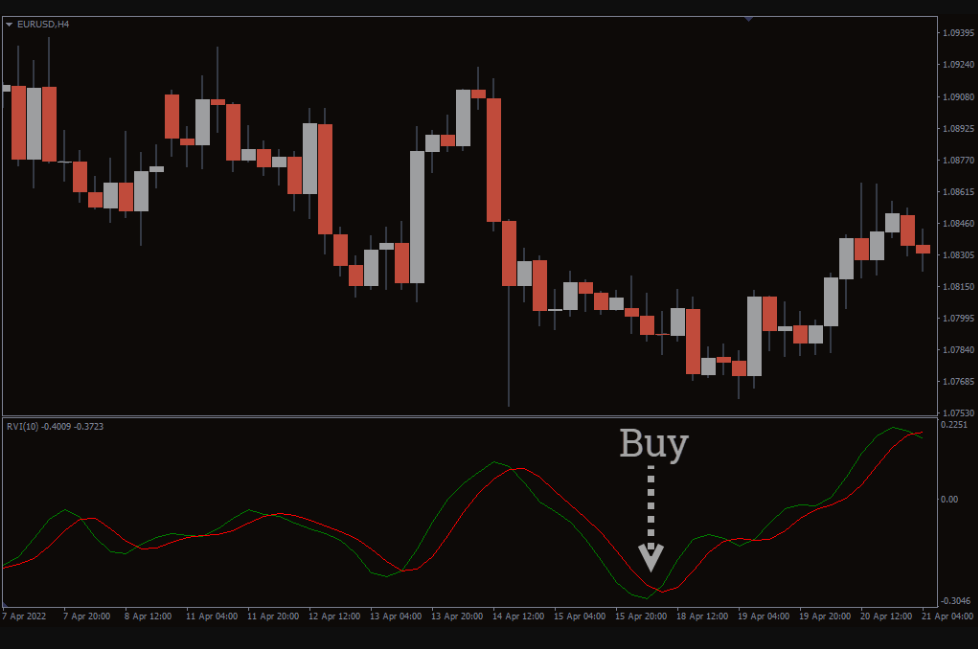
buys when the line crosses above 20 from below (indicating bullish momentum);
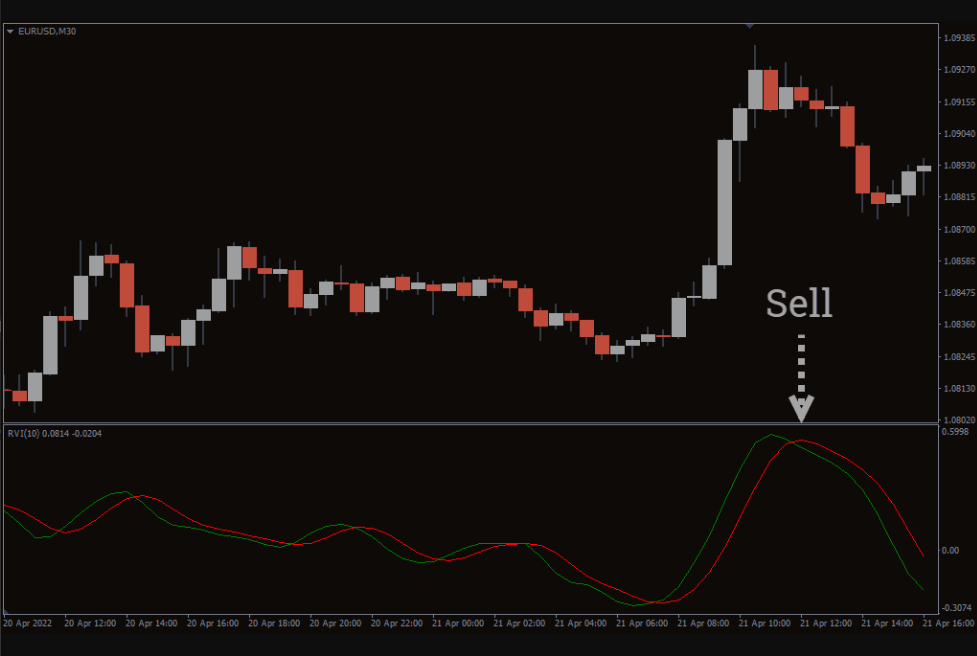
sell when the line crosses below 80 from above (indicating bearish momentum);
and exit or take profit when the line crosses back above 20 after being below 80 (confirming a change in trend).
The main idea behind the RVI technical indicator is that prices tend to close near their high during an uptrend and near their low during a downtrend, so the distance between the highest close and the lowest close will be larger during an uptrend than during a downtrend. This distance is used to calculate the RVI. When combined with other technical indicators or price patterns, the RVI can be used as a powerful tool for forex traders.
How to interpret the Relative Vigor Index
The RVI is a great tool for determining when markets are in an oversold or bought state. It will send you signals telling whether the market has gone too far below average prices, and it can also signal that they’re about to go back in another direction.
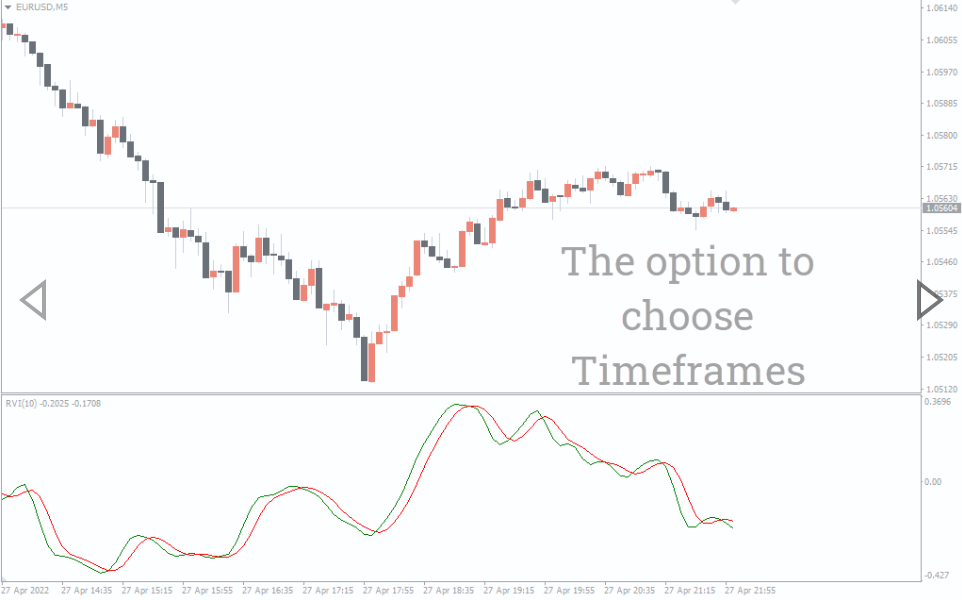
Keep always an eye on the two lines: RVI and Signal.
Whenever the indicator is above the signal line (green line above the red one) it is a signal that a bullish trend is going to start.
On the opposite, when the signal line is above the indicator (red line above the green line) it is a signal that a bearish trend is likely to begin.
Conclusion
The Relative Vigor Index (RVI) is a technical indicator that traders use to identify overbought and oversold conditions in the market. It can be used as a standalone tool or in conjunction with other indicators to help you make more informed trading decisions. RVI is based on the idea of buying when there is “vigor” in the market and selling when there is “weakness”. In this article, we’ve explained what RVI is, how it works and how you can use it to improve your trading results. Have you tried using RVI in your own trading? What have been your results? Let us know in the comments below.
You must be logged in to post a review.

Copyright 2025
Reviews
There are no reviews yet.