Learn to trade forex & stocks using the Buyers vs Sellers Indicator for MT4. Helps determine bullish/bearish trends & valid price swing levels in all markets
The Buyers vs Sellers indicator represents a MetaTrader tool for identifying trend-reversal signals for daily scalpers and intraday traders.
Analyzing bullish and bearish power is crucial for anyone who wants to trade in forex and stock markets. By understanding these two forces, traders can better anticipate price movements and make decisions about when to buy or sell.
This technical review explains how the Buyers vs Sellers indicator works on the MT4 platform, including chart examples.
How to Spot Buy-Sell Signals Using The Buyers vs Sellers Indicator in MT4
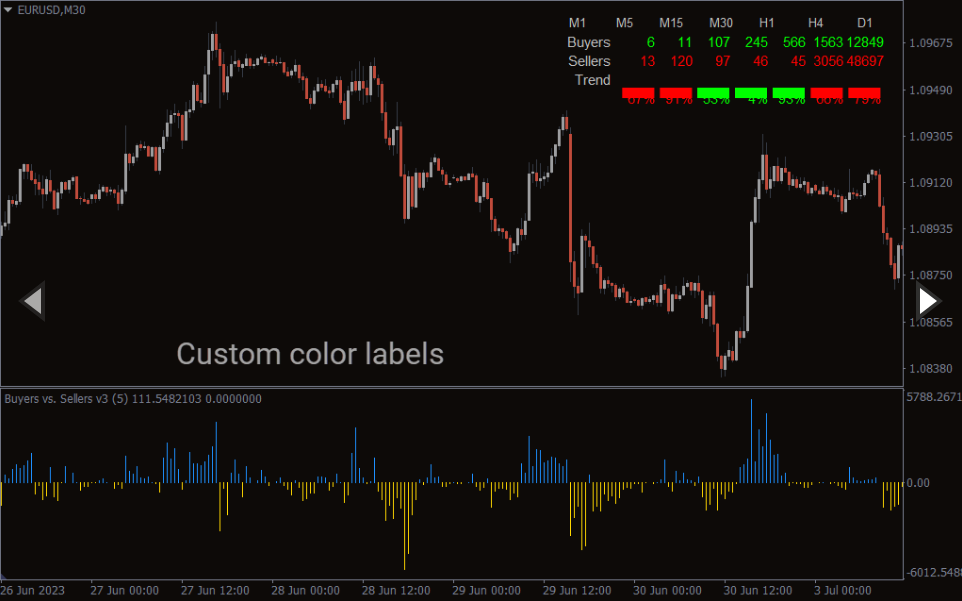
The indicator plots green bars to indicate the bullish volume and red bars to signal the bearish volume.
Bull power refers to the buying pressure in the market, while bear power refers to the selling pressure. Besides, the bars turn into a silver color when both buyers and sellers are in an equal position.
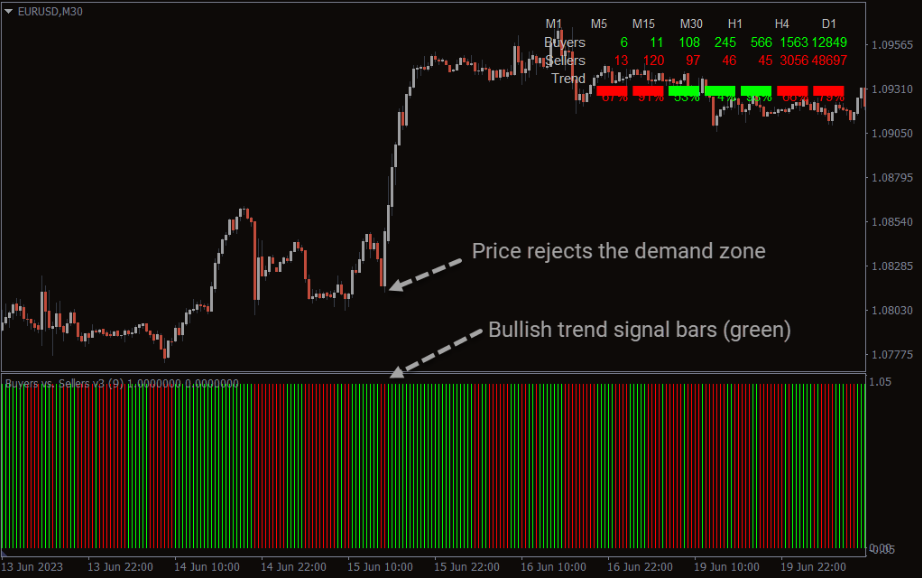
Look for buy opportunities when the price rejects a demand zone or horizontal support, and the signal bars turn green at the same time, like in the above chart example. Conversely, you can consider a sell entry when the price drops below resistance while the indicator bars are red.
Conclusion
Whether you’re trading within or against the trend, it’s always important to know where the market supplies and demands are lying on the price chart. The indicator offers technical insights into market trends by tracking the changes in buy-sell pressures. You can consider traditional support/resistance and trend oscillators alongside the indicator for better results.
Reviews
There are no reviews yet.
Be the first to review “Buyers vs Sellers Indicator” Cancel reply
We use cookies to ensure that we give you the best experience on our website. If you continue to use this site we will assume that you are happy with it.Accept

Reviews
There are no reviews yet.