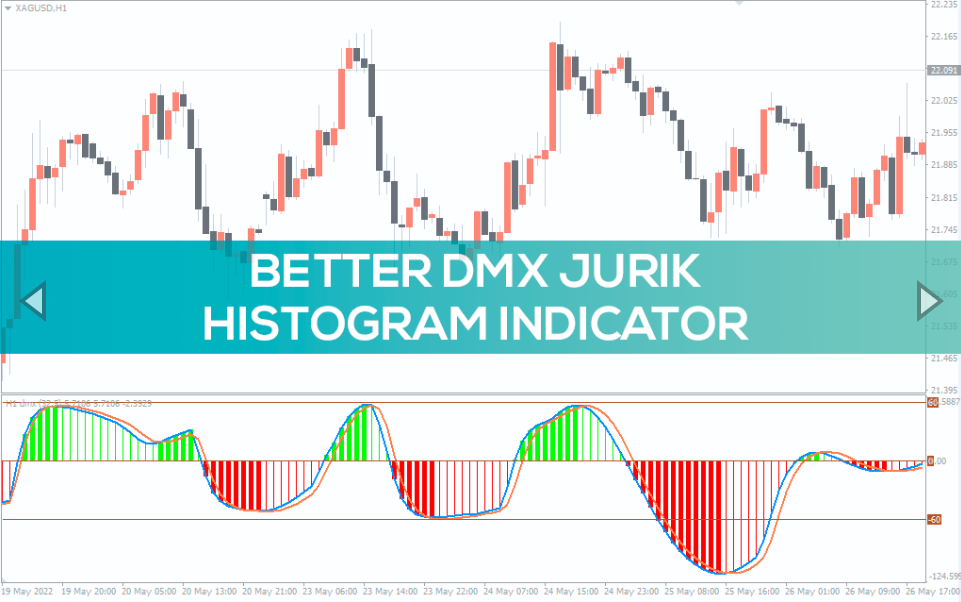
Better DMX Jurik Histogram Indicator
Better DMX Jurik histogram is an indicator that shows the market trend. The simple to use indicator is available free of charge.
The Better DMA Jurisk histogram combines two power indicators: the Directional Movement Index (DMX) and the Jurisk smooth histogram indicator. DMX, also known as Bipolar DMI, is calculated using conventional ADX. It tracks the current trend using double lines. On the other hand, Jurik indicators show the current momentum and detect changes in the market trend.
The technical tool is suitable for identifying the market trend and momentum. You can use it to trade any instrument in any timeframe. You can integrate it with short-term or long-term strategies.
How to Trade Using the Better DMA Jurik Histogram Indicator
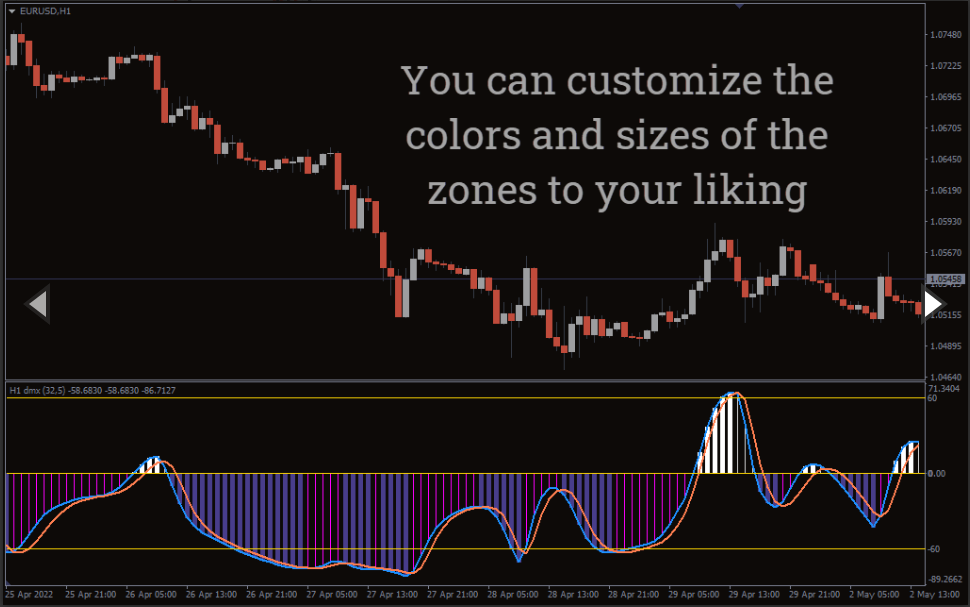
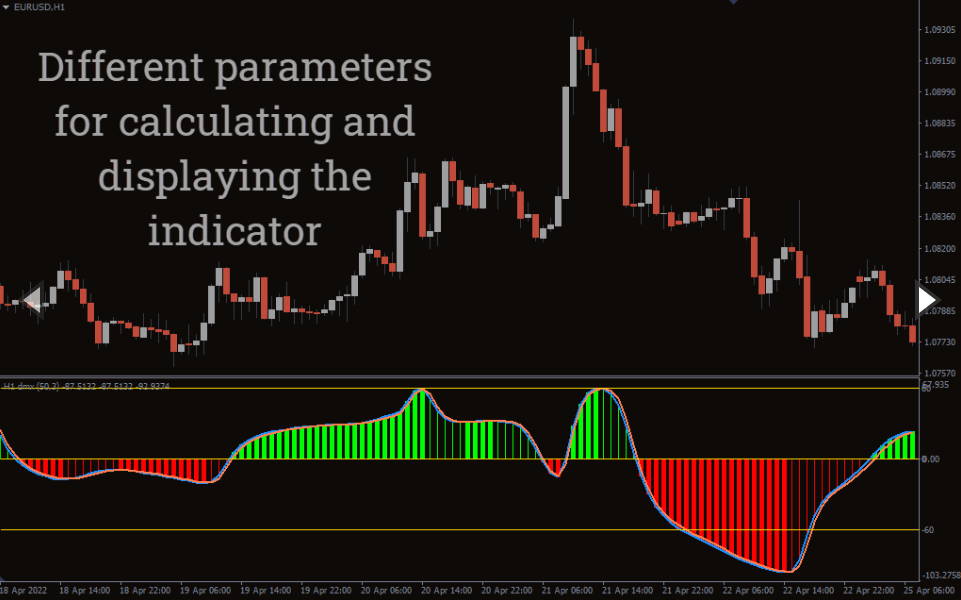
The Better DMA Jurik Histogram appears on a separate window below the price action. The DMI consists of -DI and +DI lines oscillating between the zero line and bar graphs that change color from red to green.
Buy Signal
Buy when the bars change from red to green. The bars should be above the zero line. In addition, the +DI blue line should cross above the -DI line.
Sell Signal
A sell signal occurs when the indicator crosses below the zero line. The bar changes color from green to red. In addition, the +DI line should move below the -DI.
Better DMA Jurik Histogram Real Trading Example
An ideal signal occurs when the indicator changes from green to red. You will also want to trade when the blue line changes to coral and the indicator line crosses above the zero line. Notice how the indicator changes color when the trend changes.
Similarly, a buy signal occurs when the indicator crosses above the zero line. The bar changes color from coral to green, and the +DI also moves above the -DI.
For exit strategy, you should be ready to exit when the indicators become blank. Close the trade when the color changes. You can also set the stop loss several indicators above the recent swing high or below the swing low and take profit near the next resistance and support level.
Conclusion
Better DMX Jurik histogram is an indicator that uses two indicators to provide accurate trading signals. It consists of histograms that change color from red to green and double lines that filter signals with crossovers.
You must be logged in to post a review.

Copyright 2025

Reviews
There are no reviews yet.