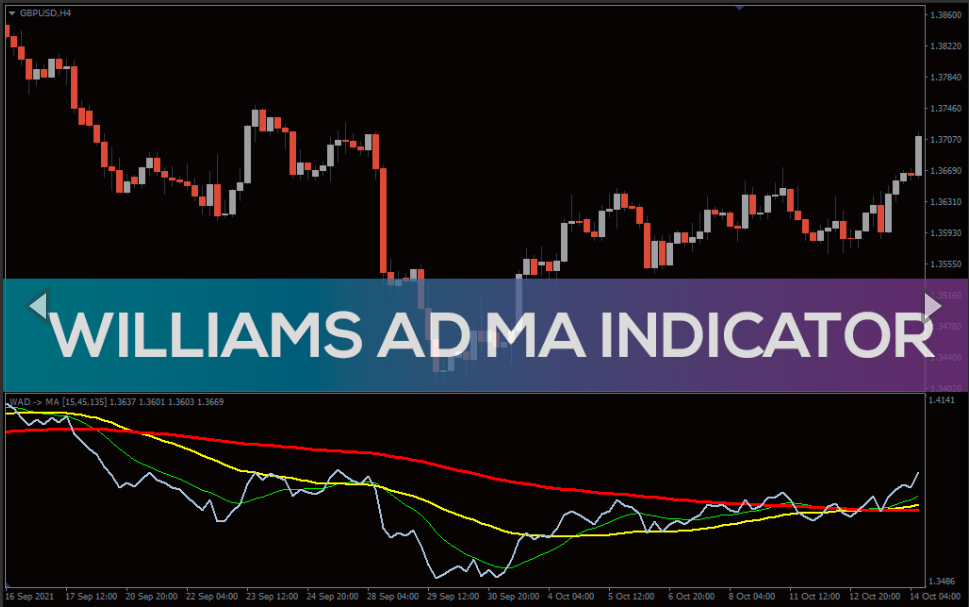
Williams AD MA Indicator
Ideal trend reversal detector. A suitable tool for identifying the market direction and suitable buy and sell signals.
Categories: Trend, MT4, Oscillator
Williams AD MA is a technical tool that provides accurate signals when used correctly. As the name implies, it combines two indicators, the Williams accumulation distribution (AD) and moving averages (MA). It helps traders assess whether a certain currency pair is accumulating or distributing. Therefore, traders can use the indicator to determine the market pressure and, ultimately, the trend’s strength.
The indicator helps determine whether the accumulation is strong enough to support the uptrend and whether the distribution is strong enough to support the bearish trend. Integrating the moving averages help interpret the market trend better and gain valuable insights into the market.
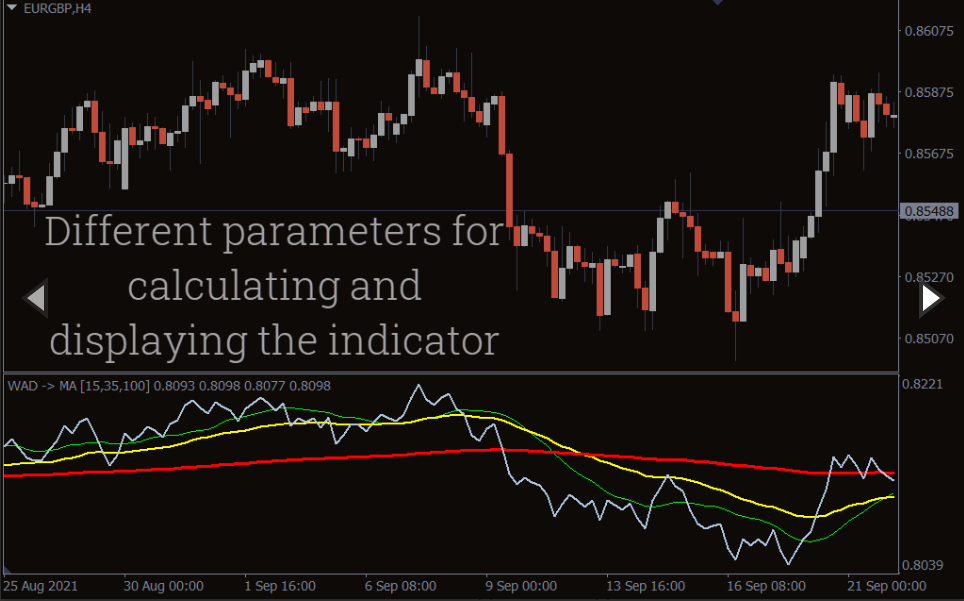
William AD MA indicator for MT4 – download free also features three linear weighted moving averages (LWMA). LWMA focuses on more recent price data and hence is more accurate. The fast moving average line uses 15 periods. The other MA line uses 45 periods, while the slow-moving average line uses 135 periods.
How to use the Williams AD MA Indicator
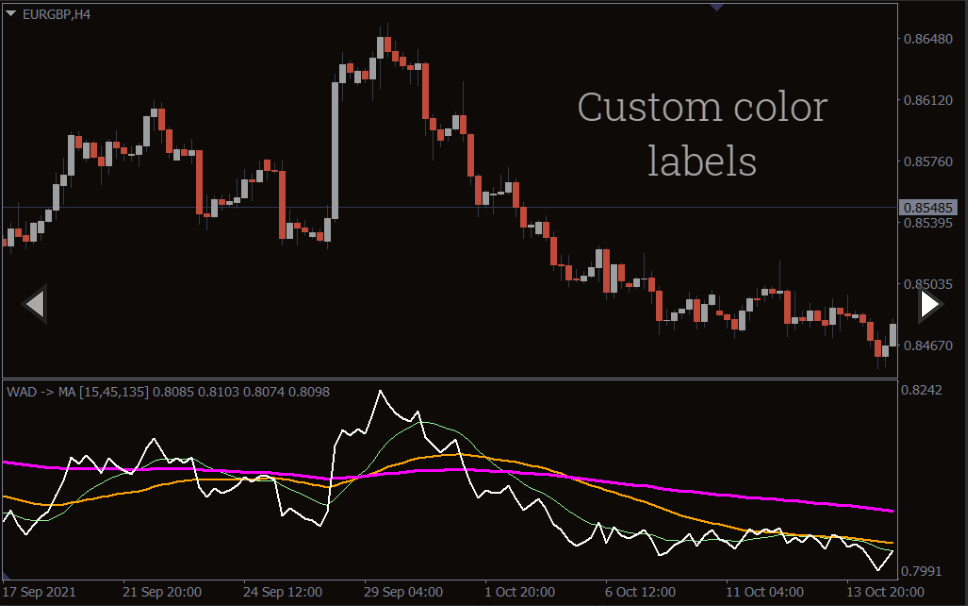
The Williams accumulation distribution line is shown by the light steel blue line. The 15 period has a lime color; the 45 period has a yellow color, while the 135 period has a red color.
During accumulation, buyers are in control and the AD line rises, signifying a bullish market. Conversely, the AD line falls during distribution when the sellers are in control of the market.
However, in some cases, there is divergence. This means that the AD line rises during distribution, signaling an impending trend reversal because the market is not strong enough to support the trend. The same case applies when the AD line falls during accumulation.
Buy Signal
The AD line is on uptrend and moves above the MA lines
The fast MA (green line) cuts through the yellow line from below
The moving average lines are rising
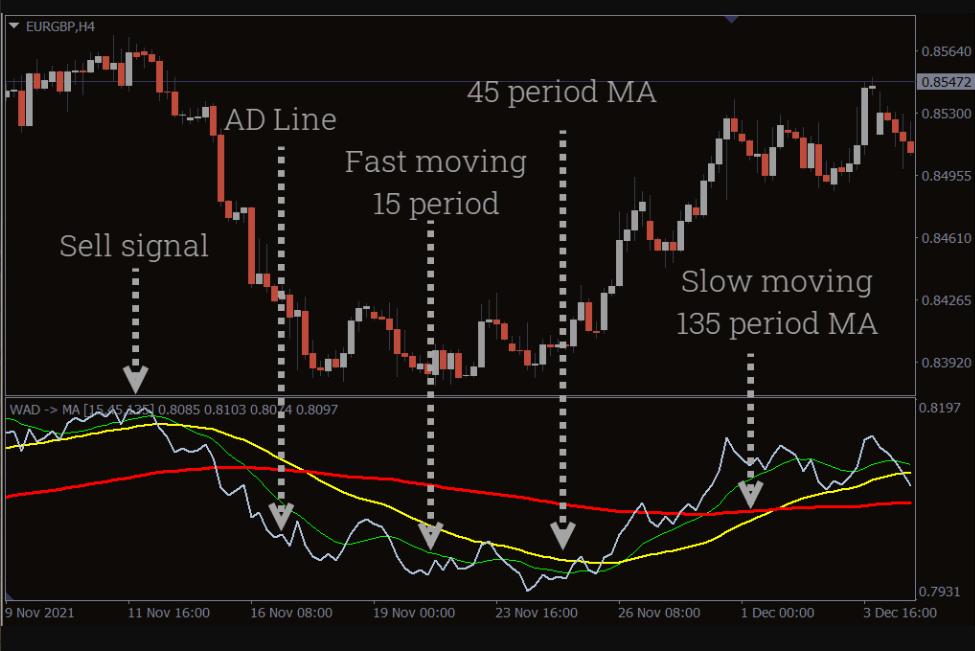
Sell Signal
The AD line is on a downtrend and moves below the MA lines
The fast MA line cuts the yellow line from above
The moving avengers are falling
The 45 period MA line acts as a suitable trailing stop loss level.
Williams AD MA Indicator Chart Example
The chart shows price movement for Great Britain against the Euro. The AD and fast-moving MA lines start sloping downwards as the downtrend begins. The AD line cuts across the MA lines from above and stays below the MA lines during the downtrend.
Similarly, the AD line crosses the MA lines from below and trends above the MA lines, indicating an uptrend. In addition, the moving average lines are also moving upwards, indicating a bullish pressure.
Conclusion
The Williams AD MA indicator can help you identify perfect trade entry points. It helps determine whether the market is trending or ranging. Using the indicator is a cakewalk. Simply enter the trade in the direction of the AD line. This indicator is suitable for enhancing price action trading strategy.
You must be logged in to post a review.

Copyright 2025

Reviews
There are no reviews yet.