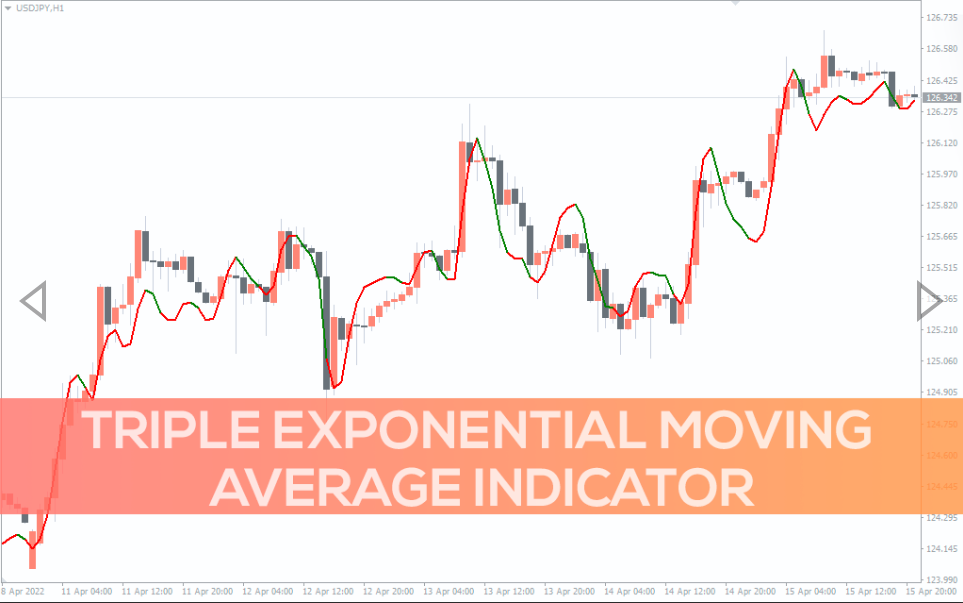
Triple Exponential Moving Average Indicator
Triple exponential moving average is an excellent indicator for identifying the trend. Suitable for trading with the price action.
Categories: Trend, MT4, Signal
When looking for trading signals, the whole idea revolves around identifying the existing trend. A moving average does a good job, and even better when enhanced. The Triple Exponential Moving Average (TEMA) detects the market trend by giving more weight to recent values. It also eliminates inherent lag associated with a smooth moving average.
The term triple EMA means that the EMA has a magnitude of three. Triple EMA is subtracted three times to eliminate lag and establish consistency with the actual data. Ultimately, this ensures the technical tool responds better than SMA and EMA.
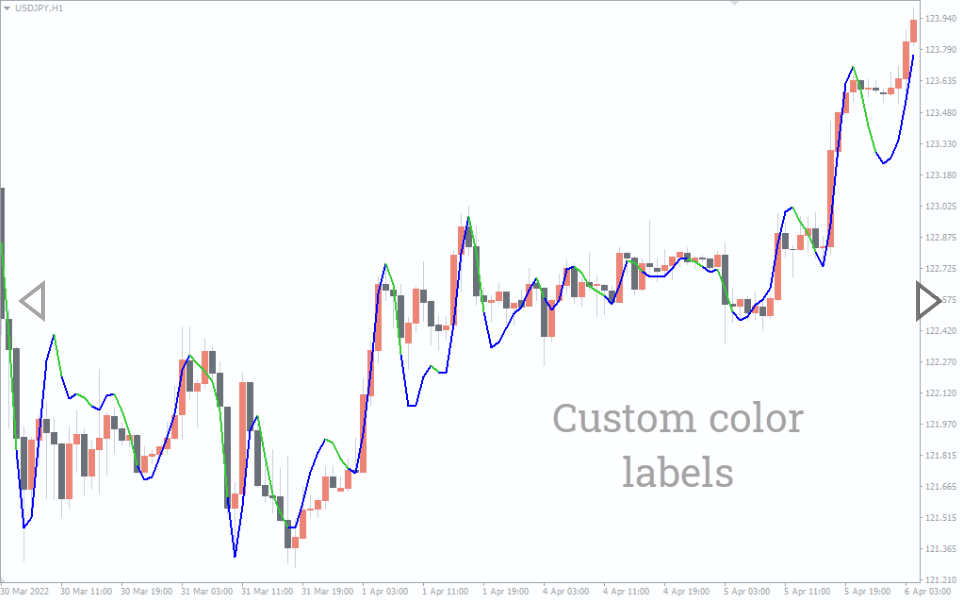
Removing the lag makes the indicator more responsive and sensitive to the price action and moves in tandem with the price. When the price action rises, the indicator has a positive slope and a negative slope during a downtrend. You can use the indicator to smooth the price.
You can use the indicator for long-term and short-term trading strategies and any time frame to trade any instrument. But it works best when used with other indicators.
How to Identify Trading Signals with Triple Exponential Moving Average
The indicator is simple to use and trade with. You simply need to identify the slope and color of the indicator line.
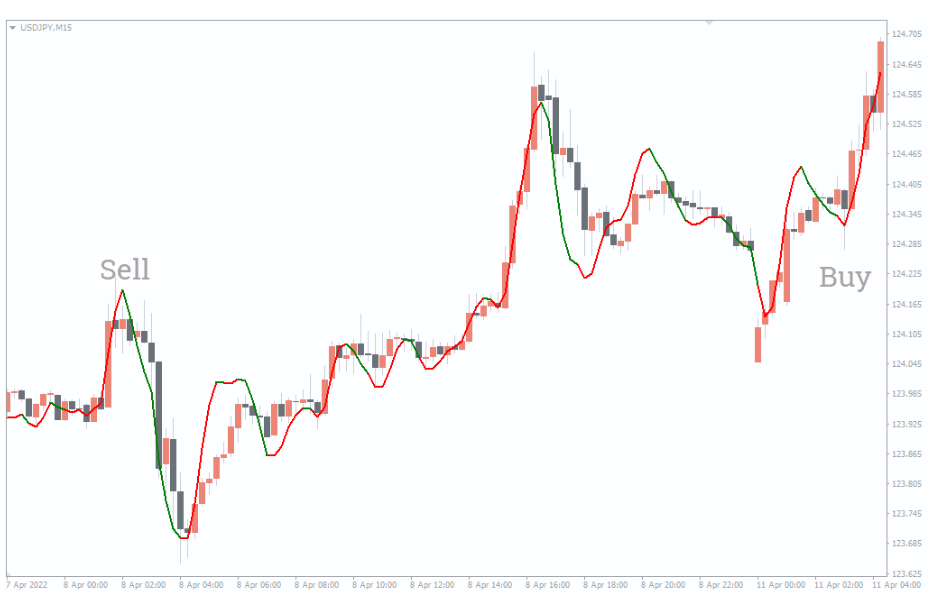
Buy Signal
Go long when the TEMA ascending line turns red. Exit when the line changes color to green during an ongoing uptrend.
Sell Signal
Go short when the indicator line turns green. Close the trade if the downtrend is ongoing and the indicator line changes color to green.
Triple Exponential Moving Average Real Market Trading Example
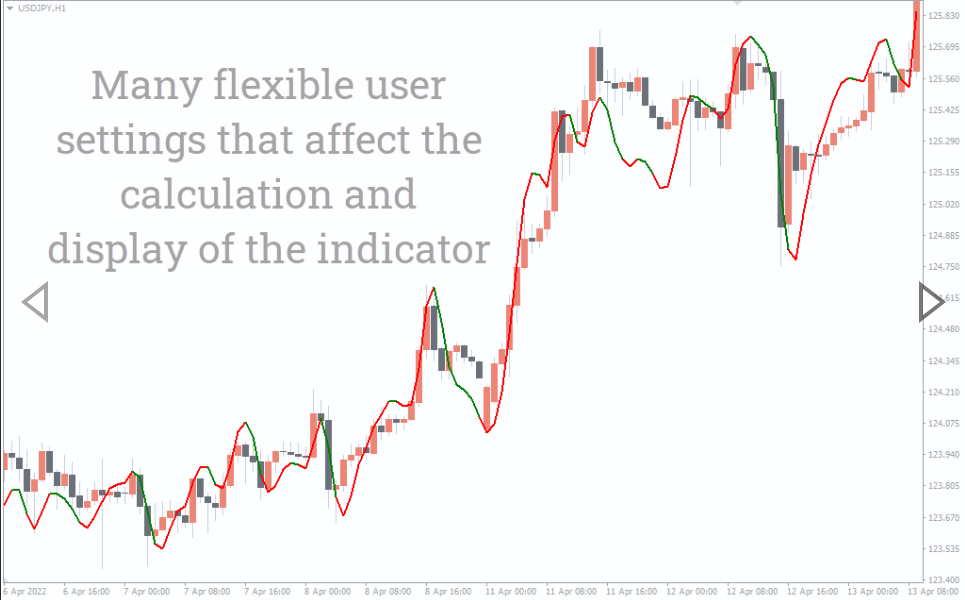
TEMA shows the price action of the US dollar against the Japanese Yen. Notice that the moving average line follows the price action in lockstep. Using the naked price action alone is challenging to filter out noise. In other words, entering a downtrend because the market has posted a bearish or bullish candle is not a prudent strategy.
But when the indicator lines change to green during a downtrend, this is a tell-tale sign of the start of a bearish trend, as shown in the chart. Similarly, a red indicator line signals that the bulls are taking control of the market.
Conclusion
The triple exponential moving average is an excellent technical tool for identifying the trend direction. It is smoothed three times to ensure it doesn’t lag and provides an accurate signal. The indicator works well with price action strategies. You simply need to identify the indicator line color and direction. Sell when it turns green and buy when it is red. It is an incredible tool if you trade with the trend.
You must be logged in to post a review.

Copyright 2025

Reviews
There are no reviews yet.