Korharmonics Indicator
Korharmonics Indicator shows the best insights into the recent price action patterns and spots profitable buy-sell setups on MT4 charts. Suits Forex & Stock trading.
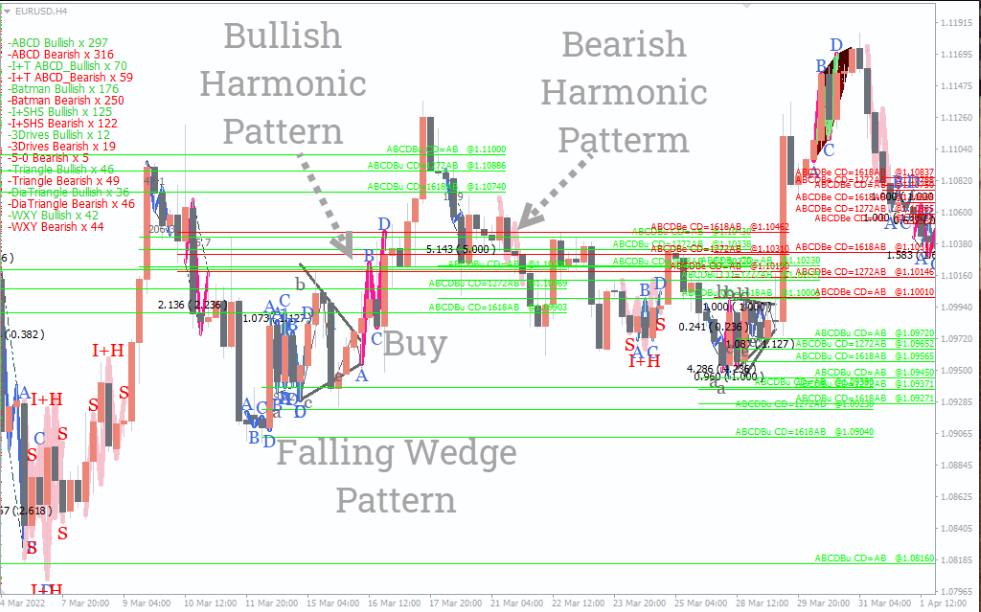
The Korharmonics Indicator is a multi-functional MT4 price-action trading tool specially developed for forex and stock traders. It automatically spots Wedge, Flag, Bat, and Harmonic patterns, which can be transformed into highly potential buy-sell setups.
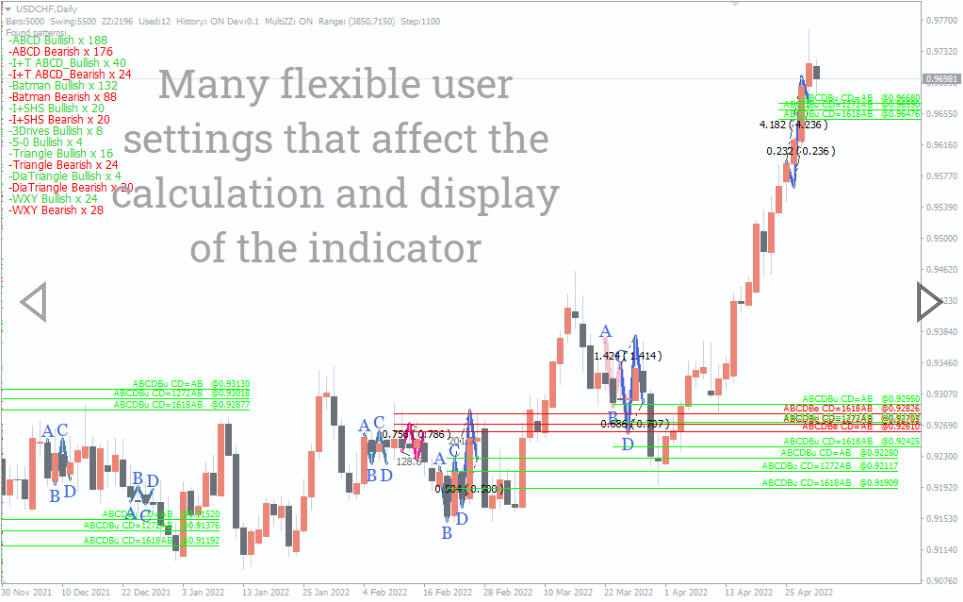
Besides the chart pattern tools, it also includes a Fibonacci retracement tool that points to possible pullback areas of the price. Fibonacci levels also guide you through potential trade entry and exit levels.
Furthermore, you can apply the Korharmonics Indicator on any timeframe depending on your trading style. However, trading based on chart patterns works better when applying it on longer timeframes.
In this guide, we’ve explained how to apply the Korharmonics Indicator in MT4 for anticipating solid price-action-based buy/sell opportunities.
How to spot highly probable buy/sell signals using the Korharmonics Indicator in MT4?
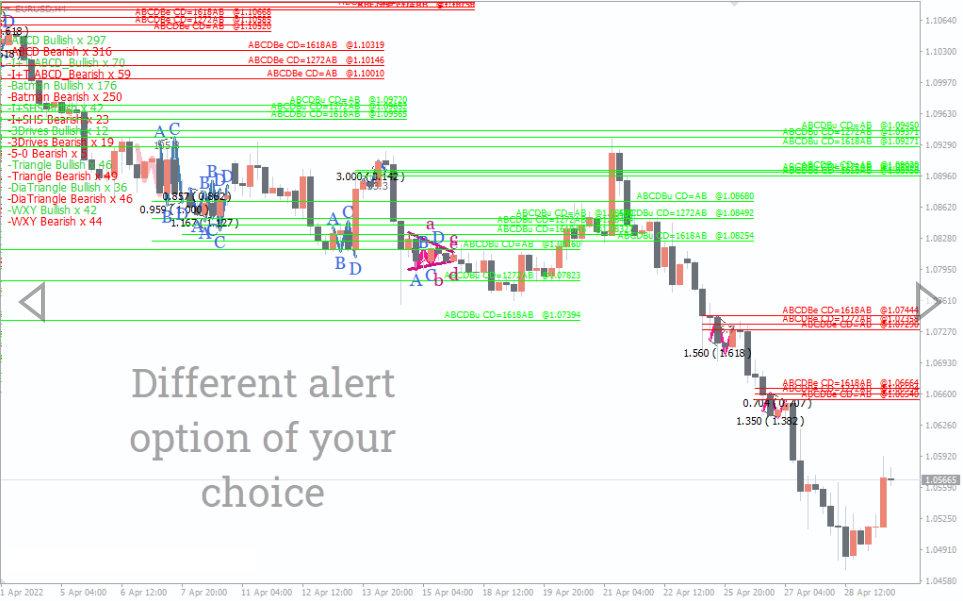
Korharmonics Indicator applies simple high-low methods for determining the harmonic pattern. A is the starting point of the harmonic structure, and B is the first swinging point of the price that determines the direction of the upcoming price movement. B closes above point A, indicating the price will form a bullish pattern. C points to the pullback or retracement levels after making the first move, and D defines the trade-entry point.
AB and CD indicate a gradual price increase in the above example of the bullish harmonic pattern, plotting multiple higher highs. As the price decides to pull back after completing the ABCD movement, we wait for further confirmation for going long. Here, we can enter a buy order once the price exceeds point D and breaks above the immediate Fibonacci level, indicating a continuation of the current bullish move.
Besides harmonic structures, Korharmonics Indicator identifies wedge patterns. The price may not reverse straight away after making a bullish or bearish move. Korharmonics connects the highs and lows of a falling wedge pattern. When the price breaks the higher trendline of a falling wedge pattern, we go for buy orders. Conversely, enter short if the price drops below the lower trendline of a rising wedge pattern.
Conclusion
The Korharmonics Indicator offers an incredible privilege for MT4 users who vastly depend on price chart patterns to make trading decisions. It alone guides you through useful price information regarding trends and buy-sell positions. However, for trading based on such price structures, you must closely observe how the price reacts after forming a bullish or bearish pattern before deciding on an entry or exit. Traders with basic knowledge of candlestick patterns will find this indicator a super charting tool for spotting valid price swing points.
You must be logged in to post a review.

Copyright 2025

Reviews
There are no reviews yet.